Spectroscopy
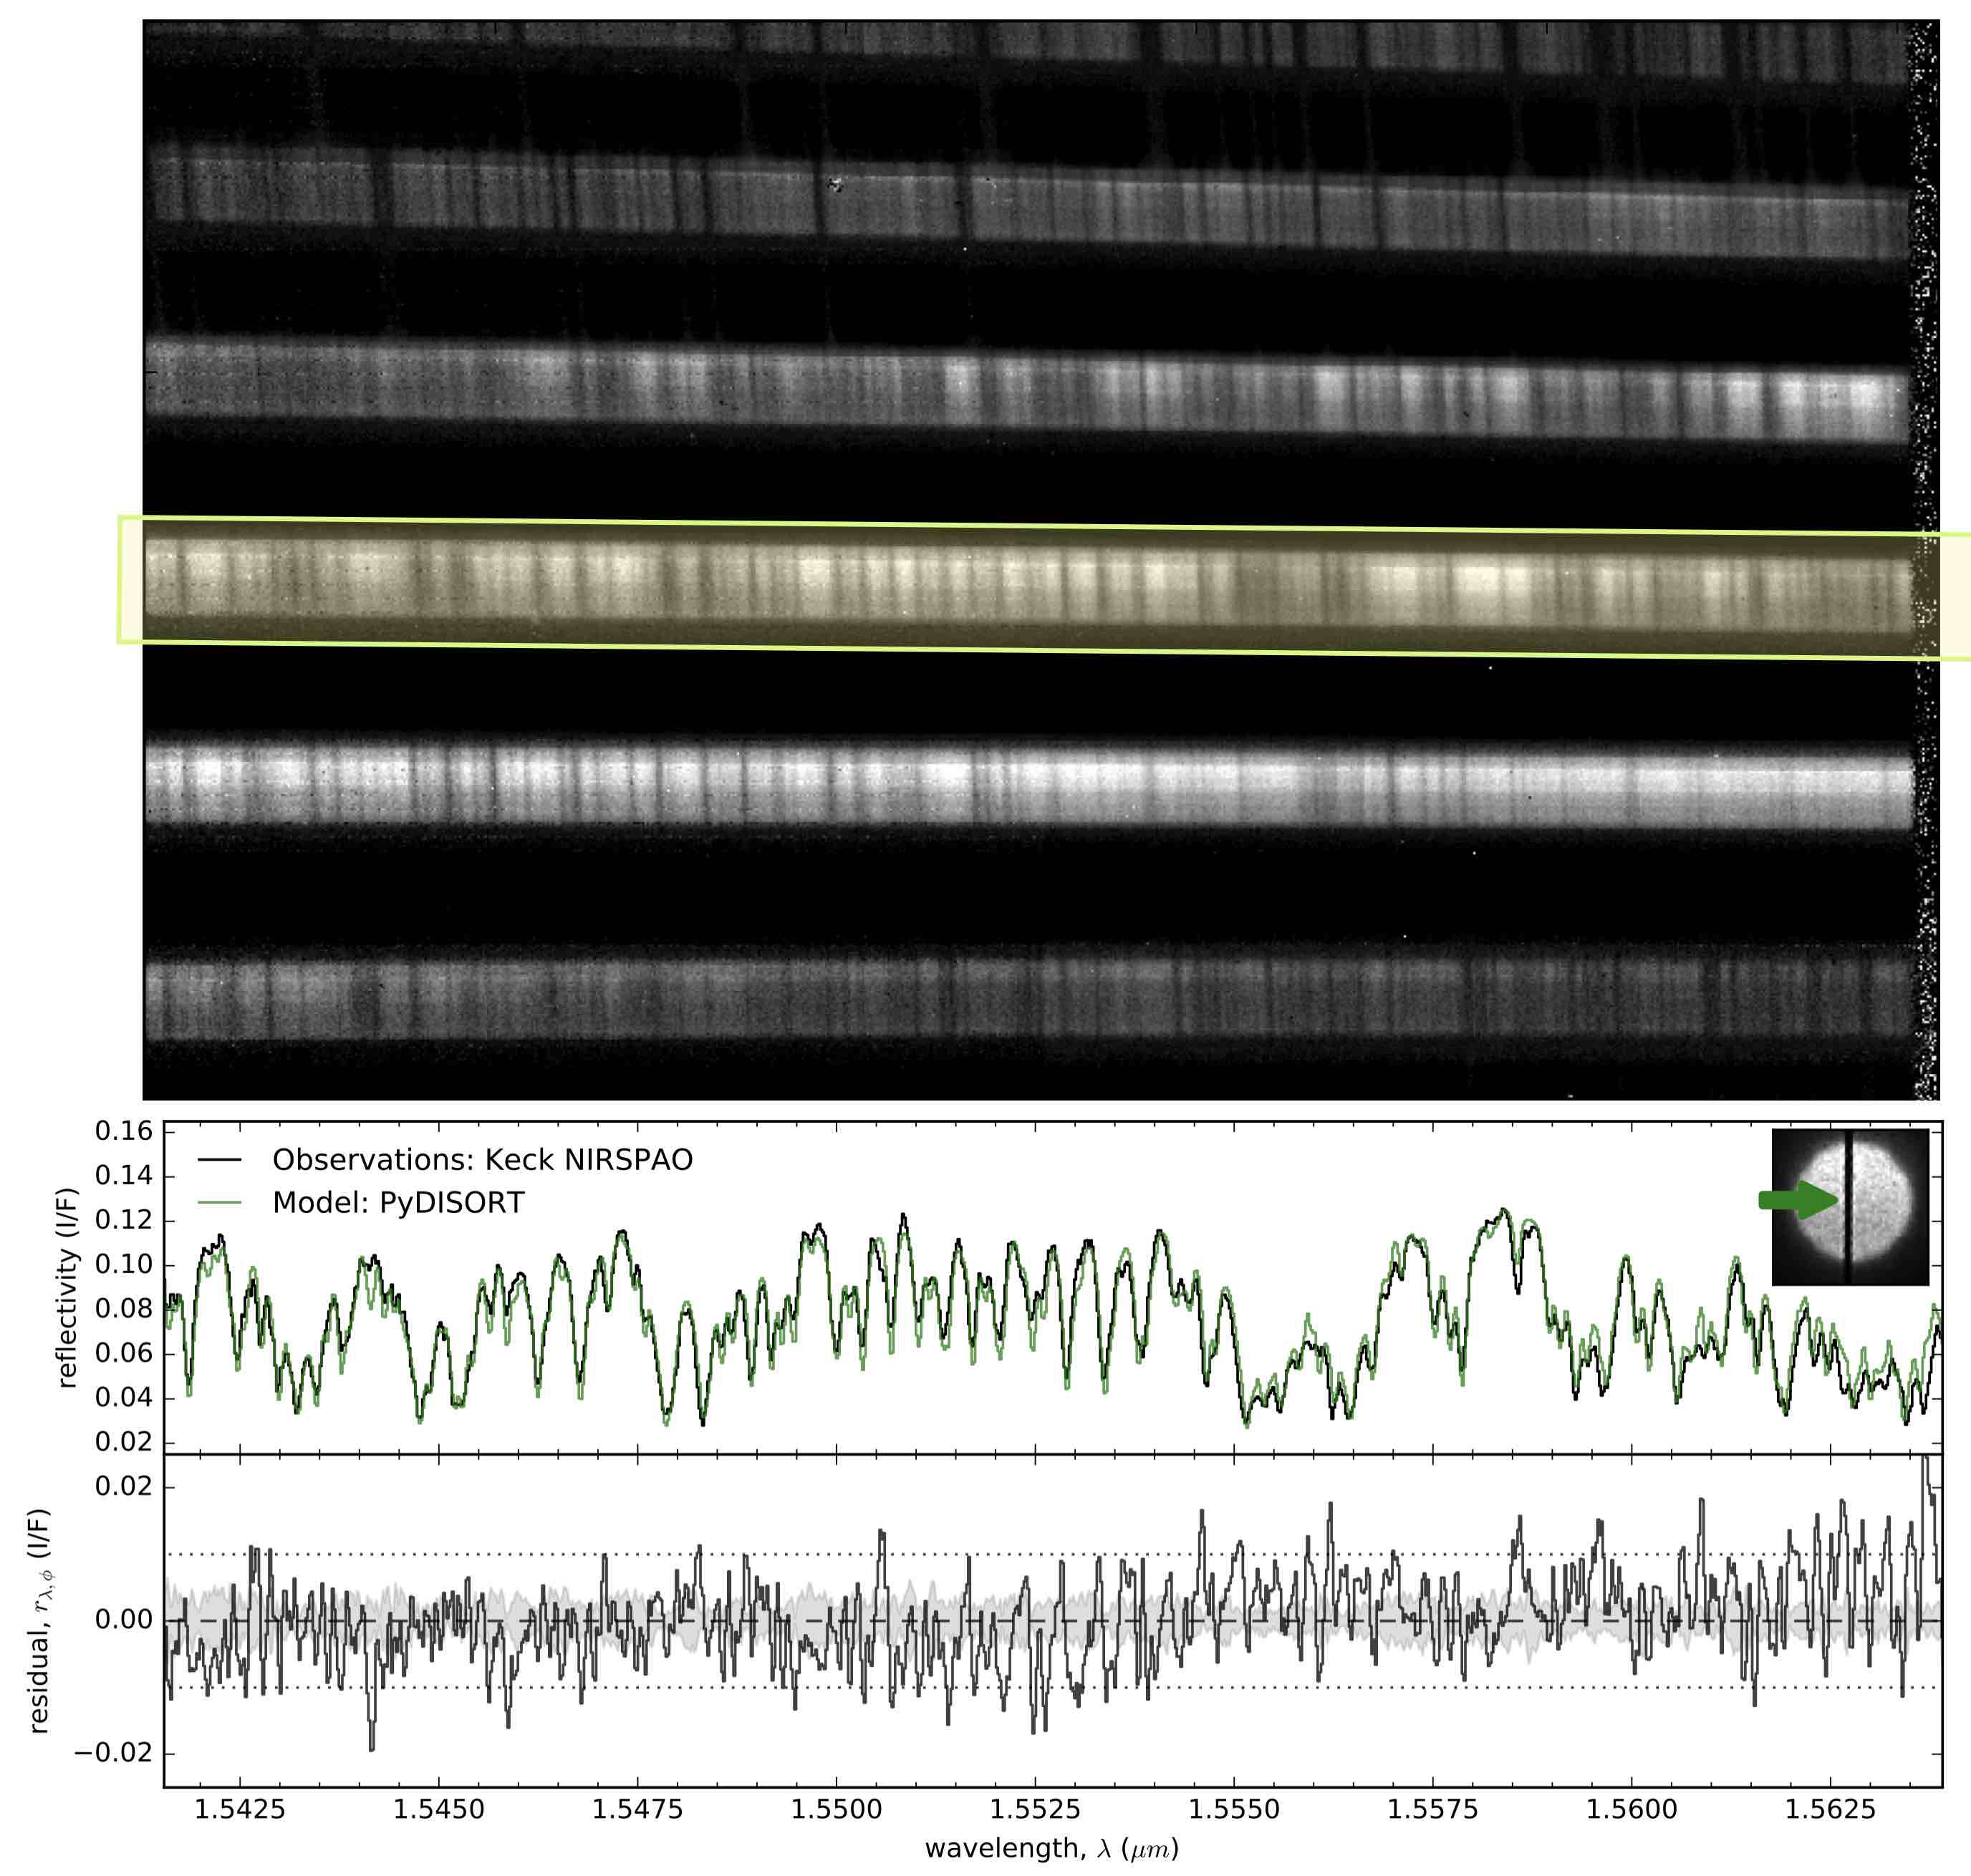
After a telescope gathers the light from a source, wrangling it into the spectrometer and passing it through a narrow slit, a dispersive element such a grating or prism can be used to separate the light into component wavelengths. An image from the NIRSPEC spectrometer at Keck illustrates how multiple orders are recorded in the 1.5$\mu$m (H-band) wavelength region are projected onto the detector.
The highlighted order is rectified and the data from a single row in the image array, indicated by the green arrow in the inset image of the spectrometer slit as it is placed on Titan, is plotted as a spectrum. In this case, all of the variation in the spectrum (corresponding to the black stripes in the image) is due to methane absorption, which can be simulated and compared with the observations.
Adaptive Optics
Temperature and pressure variations in the column of air above a telescope mean that a ray of light passes through regions of differing densities with different refractive indices. Refraction distorts the plane waves from a distance point source and results in a perturbed wavefront arriving at the telescope. In other words, a blurry image or a larger blob of light for a point source. A deformable mirror that can change shape, responding on the timescale that the atmosphere changes its turbulent structure, can then be used with a wavefront sensor, a fast computer, and clever software algorithms, to take the smeared point spread function and focus it back into a diffraction-limited spot. Comparative examples of adaptive optics (AO) images are available from various disciplines of research.
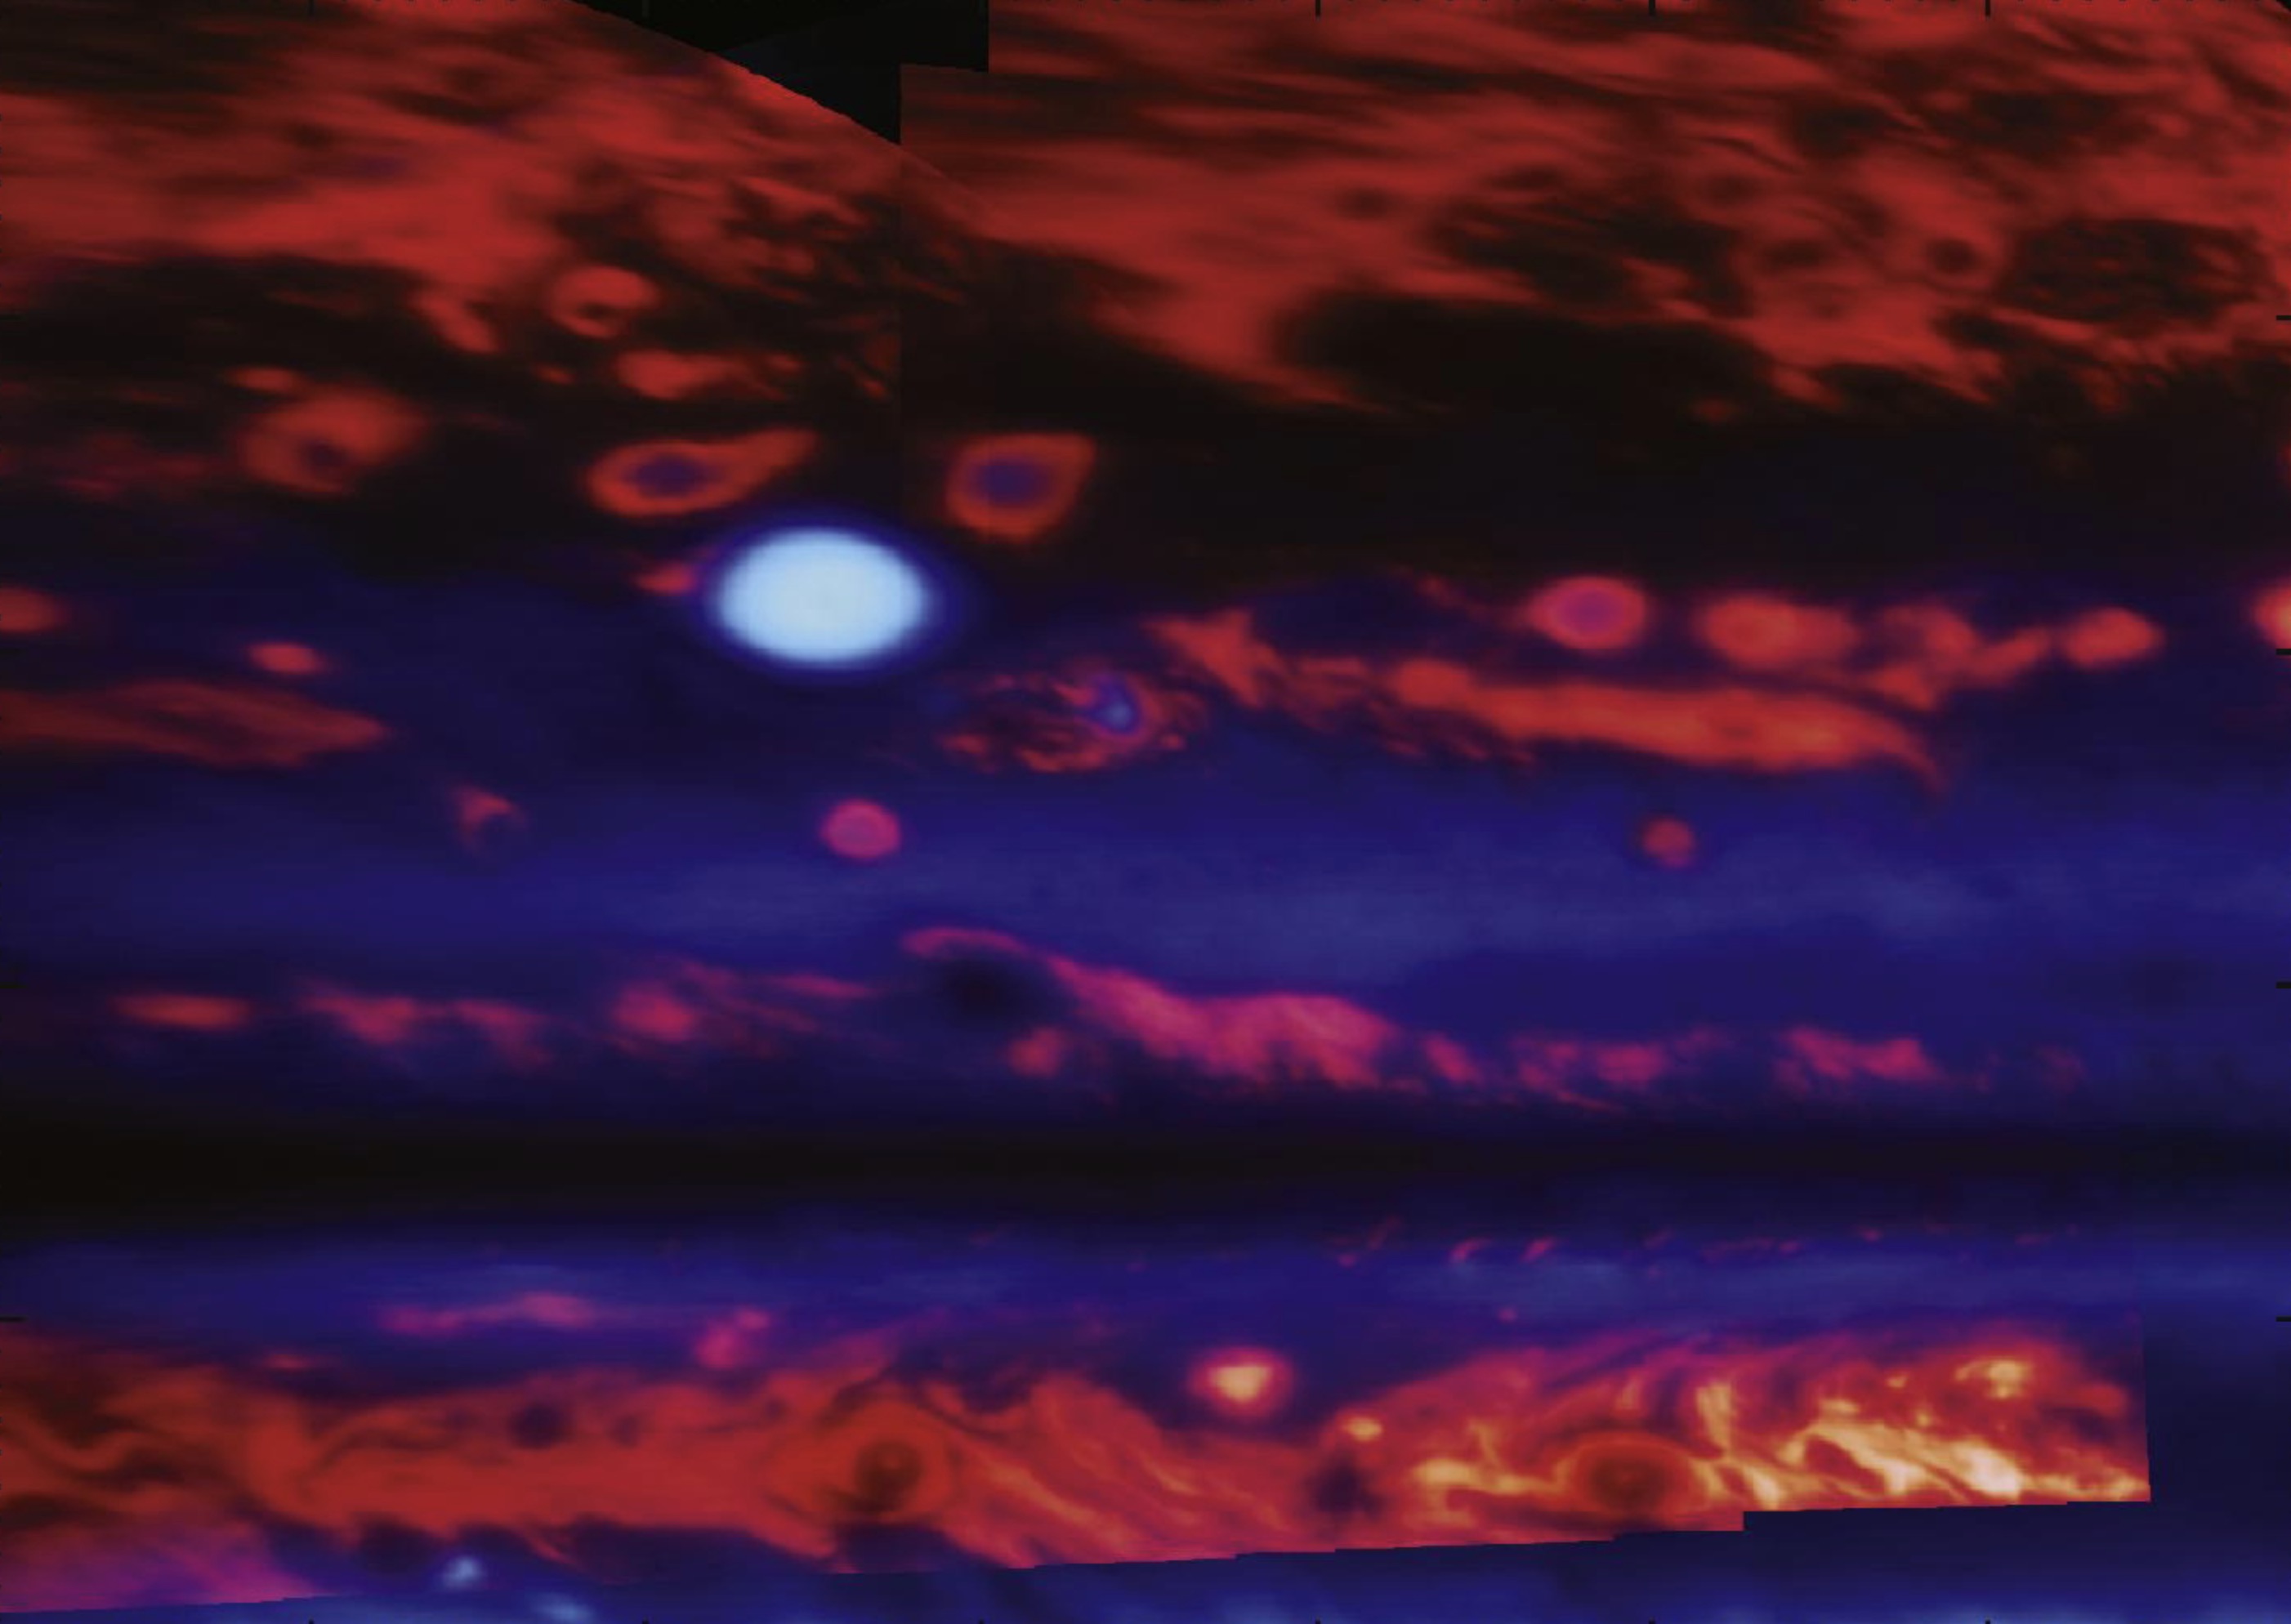
The AO image of Jupiter (above) obtained with NIRC2 at Keck, is assembled from two channels at 1.6 (blue) and 5$\mu$m (red) wavelengths. The regions that are bright in only one wavelength, as represented by the corresponding color, can be compared with regions that are either bright or dark at both wavelengths, which appear as white or black, respectively. The red-ringed structures can be resolved with AO and reveals that some vortices are differentiated in their dynamics from others that are either bright white or dark. The 5$\mu$m region is sensitive to thermal emission from deep in the atmosphere, whereas the blue channel is reflected Sunlight from high clouds.
Additional Reading
Spectroscopy and adaptive optics can be used together to study a wide variety of atmospheric processes in the Solar System. The illustrative examples to the left are placeholders for detailed studies that demonstrate how spectra can be used to determine meteorological conditions Titan, and well as the dynamics of vortices Jupiter. Instruments that combine imaging and spectral capabilities can simultaneously acquire cubes of data (with 2 spatial dimensions and 1 spectral dimension) that can be used to understand the clouds are aerosol on Uranus as well as atmospheric structure of Neptune's aerosol.
Observational investigations of the spectra of circumstellar disks motivate thermal-chemical models and challenge our understanding of the processing of material around stars in the regions where planet formation occurs.
