Once the mean value of the measurements is determined, it is helpful to
define how much the individual measurements are scattered around about the
mean. The deviation,
Since the deviation may be either positive or negative, it is often
more useful to use the mean deviation, or
It is common to report the experimental value,
where
To avoid the use of absolute values we can use the square of the deviation,
(It can be shown that for a small number of measurements, Equation 5 becomes
where N is replaced by N - 1. Your instructor may want you to use this formula instead of Equation 5.)
Finally, the experimental result,
where
Notice the
standard deviation is always positive and has the same units as the
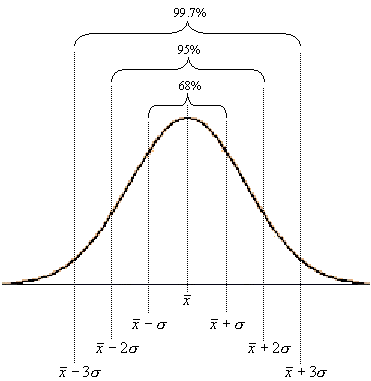
mean value. It can be shown that there is a 68% likelihood that an
individual measurement will fall within one standard deviation
(

If you have a question or comment, send an e-mail to Lab Coordinator: Jerry Hester
|
|
|
|
|
|

Copyright © 2006. Clemson University. All Rights Reserved. Photo's Courtesy Corel Draw. Last Modified on 01/27/2006 14:25:18.
|
|

 ,
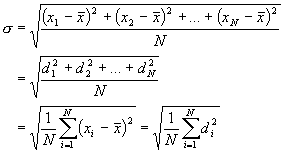
of the measured value. Standard deviation is a measure of the variation
of N data points (x1...xN) about an average
value,
 ,
and is typically called the uncertainty in a measured result.

 ,
of any measurement,
 ,
from the mean is given by

 ,
to determine the uncertainty of the measurement. This is found by
averaging the absolute deviations,
 ;
that is,

 ,
of a measurement as

 ,
to more accurately determine the uncertainty of our measurement.
The standard deviation,


 )
of the true value. Furthermore, it can be shown that there
also exists a 95% likelihood that an individual
measurement will fall within two standard deviations
(
 )
of the true value, and a 99.7% likelihood that it will fall within
(
 )
of the true value.