|
|

|
General Physics Lab: Velocity and Acceleration
|
Return to Physics Labs
Equipment and setup
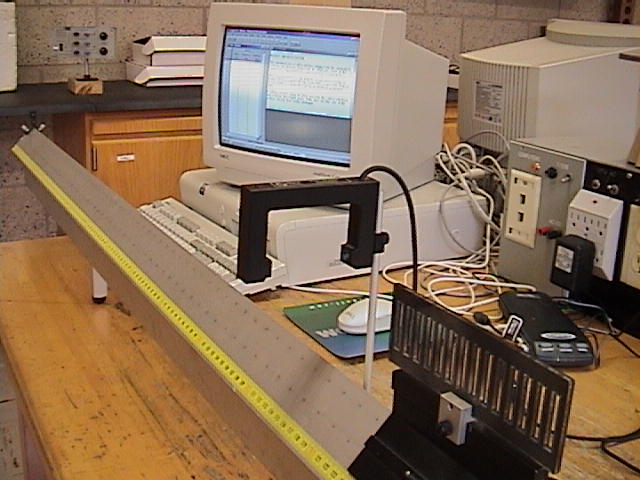
- The experiment has three parts: (1) study constant
velocity with a level air track (Figure 1),
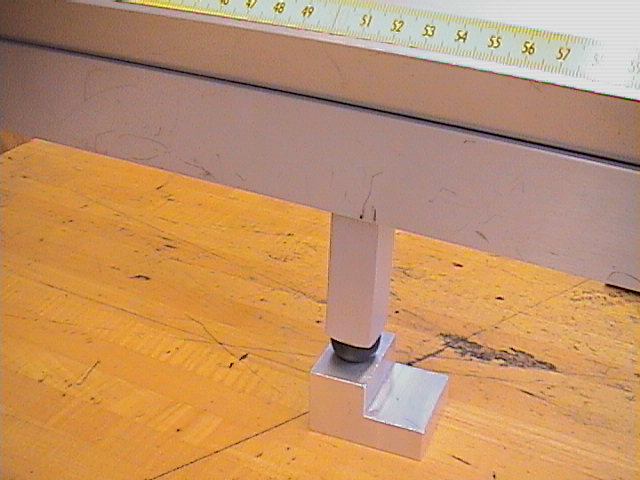
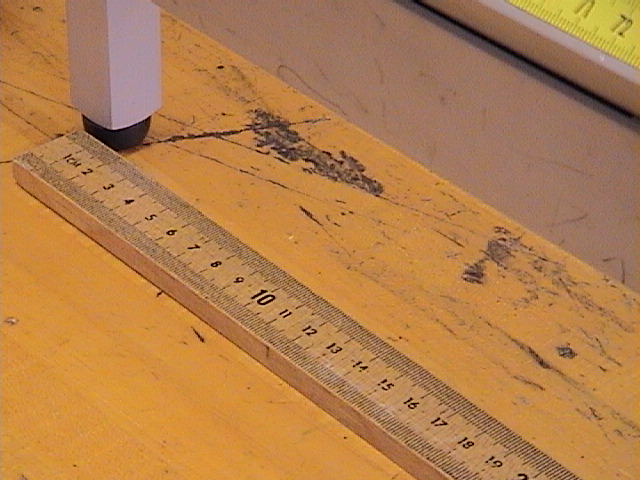
(2) study constant acceleration with an air
track inclined with a stepping block (Figure 3 and 4),
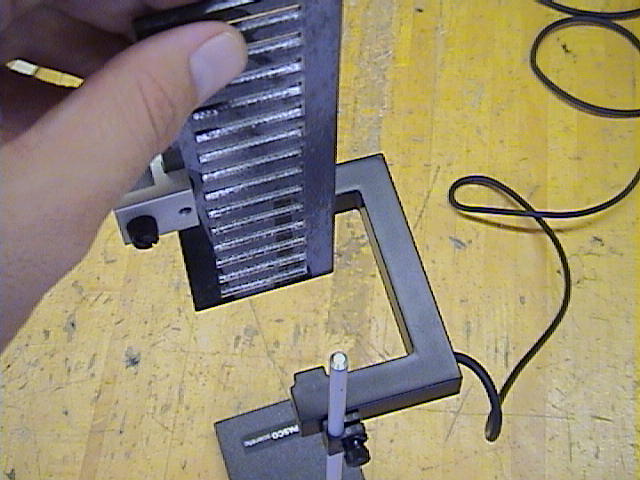
and (3) determine the acceleration due to gravity
of a free-falling picket fence (Figure 6).
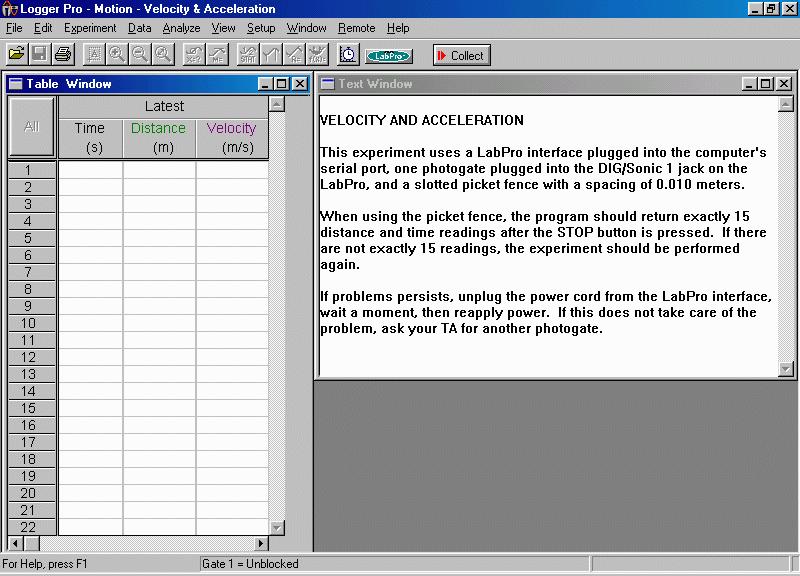
- All experiments use a photogate attached to the
LabPro computer interface (Figure 1). As the
picket fence passes through the photogate, the
LabPro sends data to the computer and the picket
fence's time, position and velocity are
displayed (Figure 2).
- The data can then be stored in an Excel spreadsheet
and graphed.
- The elevation of the stepping block is measured with a
vernier
caliper (Figure 3). The separation of the
air track's legs is measured with a meter stick (Figure 5).
- The air blowers in room (219) are located below
each lab table (Figure 7). When the experiment is conducted
in room 221, the air blowers will be found on the
table top.
|
[Click on images to enlarge.]
|
TA Notes
- Perform the experiment ahead of time!
- Don't allow the gliders to crash in to the air track stops.
- Please make sure that students place the glider on the
air track only after the air blower has been turned on.
- Adjust the height of the photogate so the picket fence
passes easily though it.
- When making a Velocity vs Time graph, make sure that students
only plot the times that match with velocity values. For
instance, no instantaneous velocities can be obtained from the
first and last times and therefore those times should not be
plotted.
- Also, in the first exercise using a level air track, the velocity
curve should be horizontal indicating a=0. However, when
students use Excel to plot their data, they may be confused because
Excel automatically scales the velocity axis making it look as though
the data is randomly displayed. Students should fix this by manually
scaling the vertical axis. (For a refresher on this, see the on-line Excel
Tutorial on
adjusting the
graph's scale.)
- In the final exercise, catch the picket fence when it dropped;
do not allow it to crash to the table top.
- It is important that the picket fence falls straight through
the photogate in the free-fall exercise.
Data, Results and Graphs
Enter TA password to view sample data and results of this
experiment:
Answers to Questions
As of now, there are no on-line answers to the questions
for this experiment.
Lab Manual
The Lab Manual for this experiment does not exist on-line.
CUPOL Experiments
Take a look at these CUPOL experiments for an on-line laboratory
experience:
If you have a question or comment, send an e-mail to Lab Coordiantor:
Jerry Hester
Return to Physics Labs
|
|