
The Clemson-INAF CT-AGN Project
As already stated, the CCTAGN project has as an objective to find CT-AGN within the local (~200 Mpc) Universe, using a volume-limited sample in order to derive the true fraction of these sources amongst the AGN population. In order to achieve this goal, we have a two-step approach: selecting new Compton-thick AGN candidates in the local Universe, and then confirming their nature and characterizing them. In order to carry out the project, we target local AGN using all X-ray facilities available to us: Chandra, XMM-Newton, NuSTAR and Swift-BAT. In the past five years, our team has got a total of XX different proposals accepted in the frame of this project: XX with Chandra, and XX with NuSTAR (with simultaneous XMM-Newton observations).
Finding New Compton-Thick AGN
Compton-thick AGN are elusive, which makes increasing the sample an arduous task. An essential part of this project is pre-selecting good candidates for X-ray follow-up observations. We have done this in two main ways: through a comparison between the BAT-detected flux and the ROSAT-detected flux (a ROSAT non-detection of a bright BAT source implies heavy obscuration); and through machine-learning techniques, which compare the infrared and soft X-ray fluxes of nearby AGN.
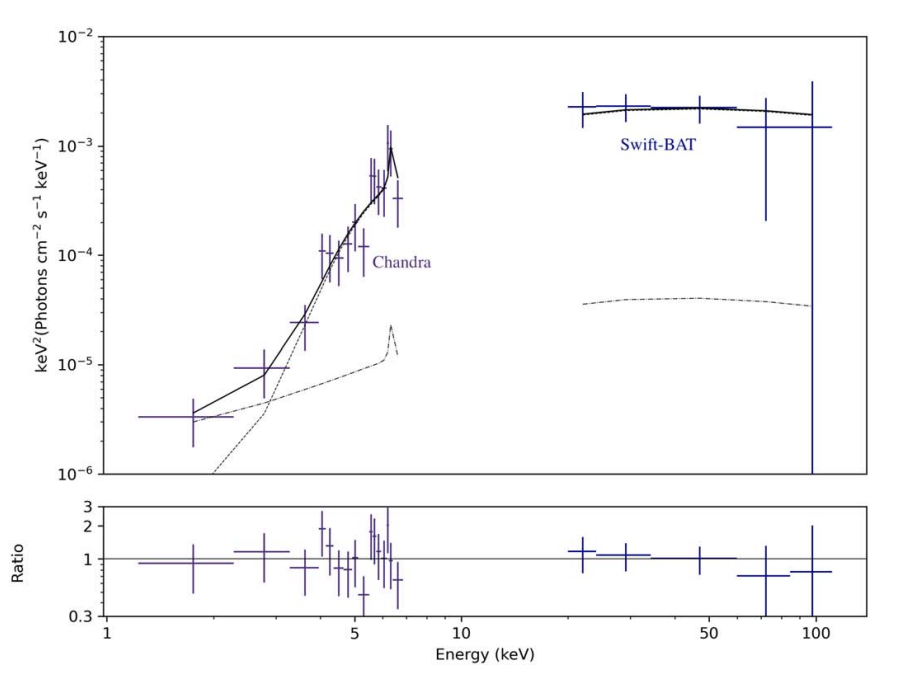
Once a source is deemed a good candidate based on the previous pre-selections, we target it with snapshot (~5 ks) programs with either Chandra or XMM-Newton. A joint fit of the soft X-ray data and the BAT spectra can either confirm the candidacy of the source, or eliminate it from the list of potential CT-AGN.
The following publications are part of this effort: Marchesi+2017a, Marchesi+2017b, Silver+2022, Silver+2023, Cox+2025.
Characterizing Compton-Thick AGN
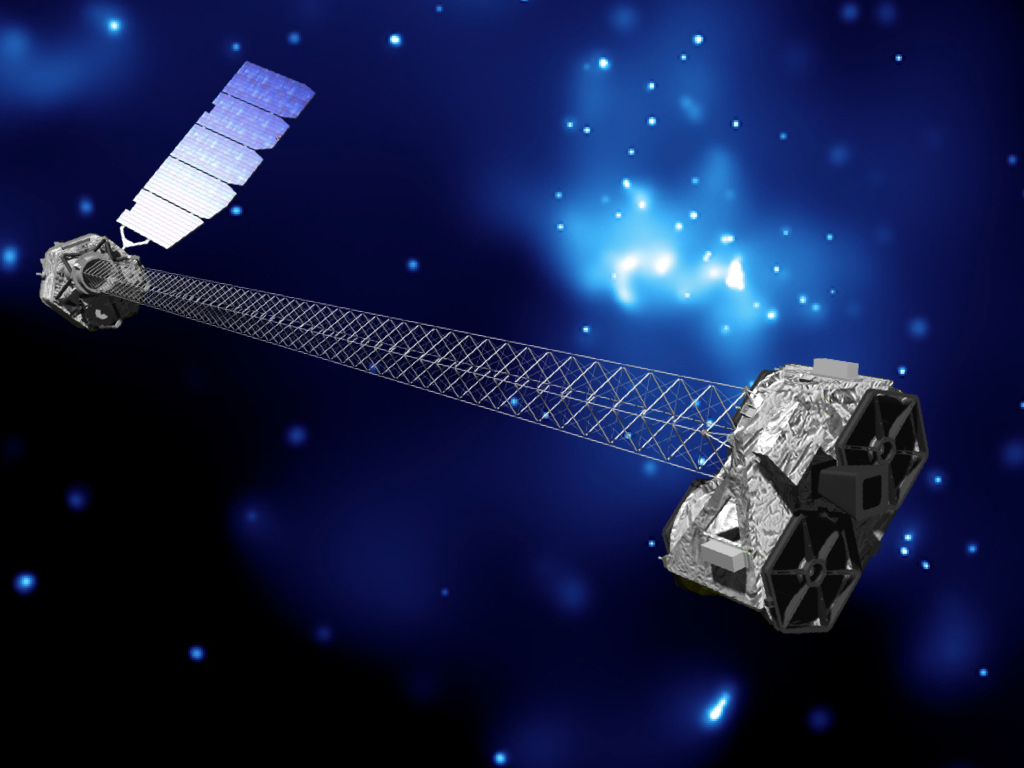
With only soft X-ray information, or soft X-rays and BAT, it is not possible to fully confirm the Compton-thick nature of an AGN. This is because previous works have shown this simpler method tends to overestimate obscuration. NuSTAR, with its high sensitivity in the 3-78 keV range, covers the peak of the reflection component in X-ray spectra. As such, it is needed to break down degeneracies between obscuration, photon index, and reflection parameters. The Compton-thick nature of an AGN can only be reliably confirmed with a NuSTAR observation.
As part of our project, we follow-up on all Compton-thick AGN candidates with simultaenous XMM-Newton + NuSTAR observations. Through spectral fitting of the data, we confirm their nature. We also aim to fully characterize these sources through spectral fitting, and to provide our results: derived parameters (such as photon index, obscuring column density, covering factor, etc.), X-ray data and best-fit models can all be found in the Data section of this website.
The following publications are part of this effort: Marchesi+2018, Zhao+2019a, Marchesi+2019a, Zhao+2019b, Marchesi+2019b, Zhao+2020, Torres-Albà+2021, Traina+2021, Silver+2022, Sengupta+2023.
New Observation-based clumpy torus model
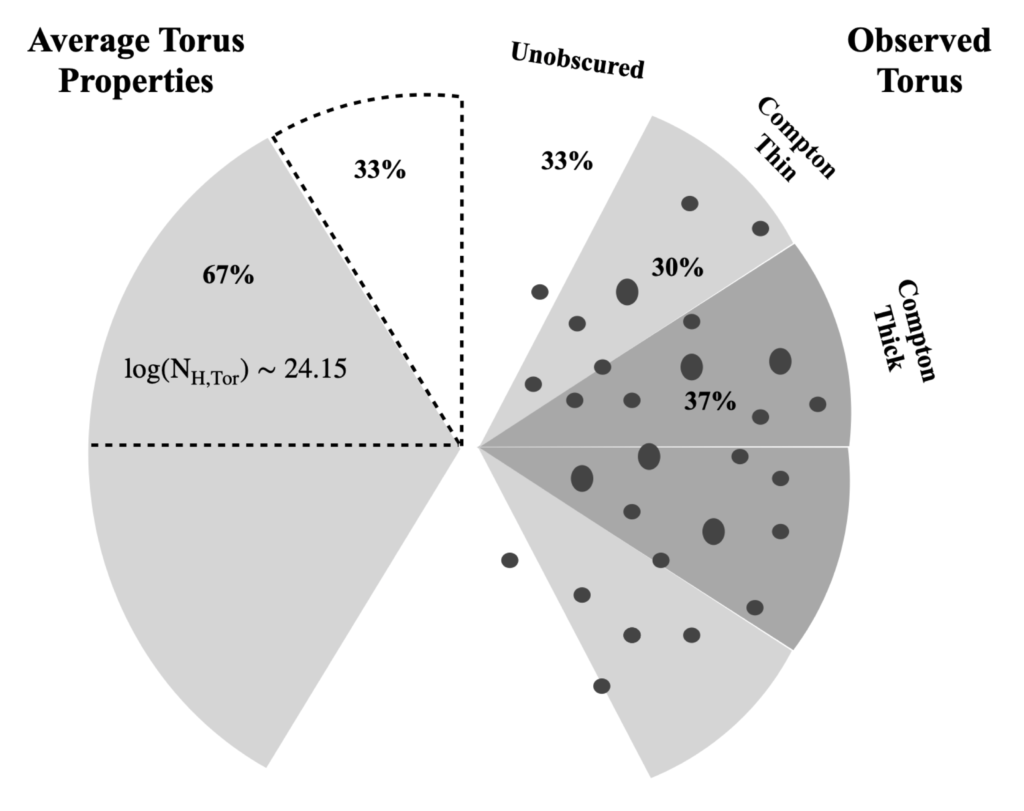
In this work, we perform a broadband X-ray spectral analysis of a large unbiased sample of obscured AGN in the nearby universe which have high-quality archival NuSTAR data, enabling us to accurately characterize the physical and geometrical properties of their obscuring tori. We find that different types of AGN may possess similar tori, which are on average Compton thick and are significantly clumpy.
Utilizing the obtained information about the torus column density, torus covering factor, and torus clumpiness for all sources in our sample, we develop a new clumpy torus model of AGN. Using our new model, we predict the observed column density distribution of AGN in the nearby universe, which we find in good agreement with the constraints from recent population synthesis models.
The corresponding article is Zhao+2021.
Obscuration Variability in Nearby AGN
Our group’s research has a strong focus in finding and characterizing heavily-obscured sources, but it is becoming increasingly apparent that the line-of-sight column density of an AGN is not static. In fact, obscuration variability can happen in timescales as short as <1 day, and as long as years. To date, very little is known about the average behavior of AGN in regards to obscuration variability; from how common it is, to how its incidence depends on timescales, and how much is typically varies. In recent years, our group has focused in characterizing this very unknown phenomenon, in two major ways: simultaneous spectral fitting, and hardness-ratio searches of large archival samples.
Multi-epoch X-ray spectral fitting of obscured AGN
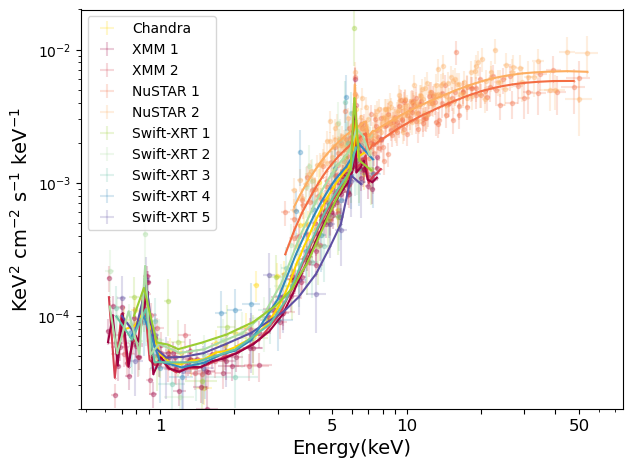
Simultaneous fitting of 10 X-ray observations of Mrk 477, showing spectral variability attributed to changes in obscuration. From Torres-Albà+2025.
The multi-epoch spectral fitting performed is based on the premise that certain AGN geometry parameters do not vary between observations. More specifically, the torus geometry (i.e. covering factor, average density, inclination angle) remains stable on timescales of ~20 yrs. Under this premise, which is true as long as reflection originates in ~torus scales, we can fit all available spectra together, forcing the reflection parameters to remain unchanged. This allows us to place stronger constraints on the line-of-sight obscuration, and therefore enables the study of its variability.
Within the project, we have fit 28 local AGN, with a total of more than 150 observations so far. Our current results allow us to only claim ~37% of these source to be obscuration-variable; and we observe an increase in the probability of obscuration variability with the time difference between observations.