Active Galactic Nuclei (AGN)
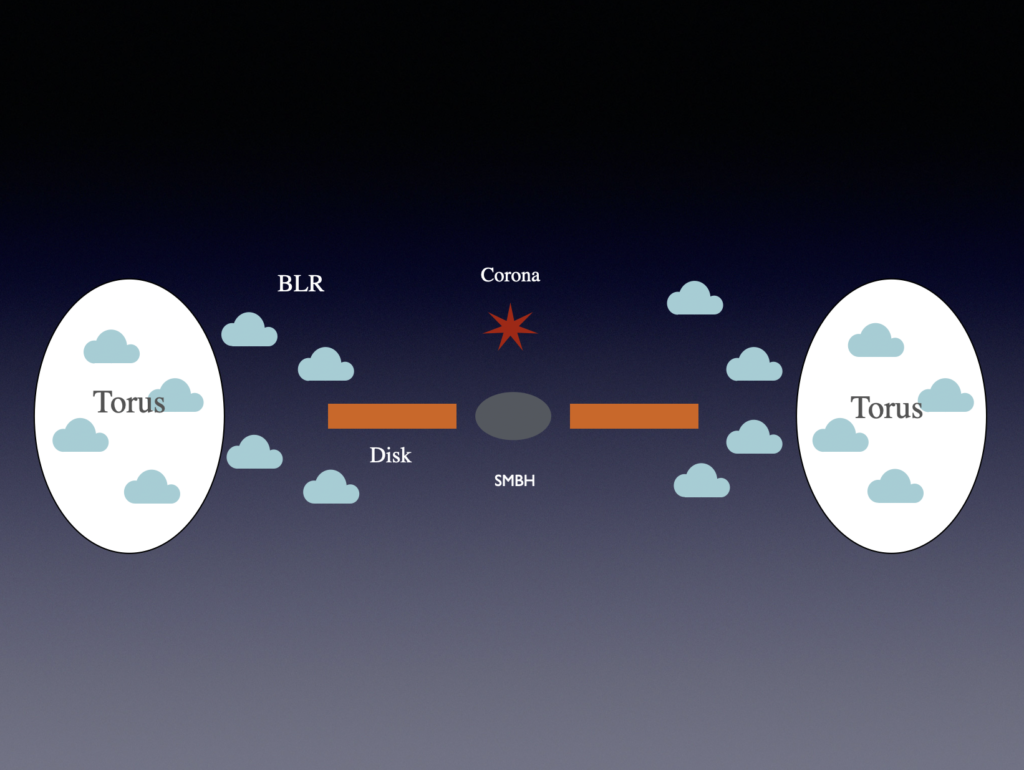
AGN are one of the most luminous, persistent sources in the Universe; emitting intensely in the whole range of the electromagnetic spectrum. The large energy output has its origin in the accretion of nearby material onto a supermassive black hole (SMBH; MSMBH = 106 -1010 Msun). Infalling gas settles around it in the form of an accretion disk and spirals inwards as it loses energy, heating up to extreme temperatures through friction. The disk emits thermally, through a superposition of black-body spectra, in the range of infrared (IR) to ultraviolet (UV).
The SMBH, along with its accretion disk, lays within a dusty gas torus, which obscures certain lines of sight. The torus is thought to have a patchy nature, being composed by clouds of different densities rather than by a slab of homogeneous material. Gas clouds orbit the central engine at large speeds, producing broad lines in the optical/UV, and compose what is known as the Broad Line Region (BLR).
The corona has an unknown geometry, but it is a hot plasma of electrons placed somewhere near the accretion disk.
X-ray emission of AGN
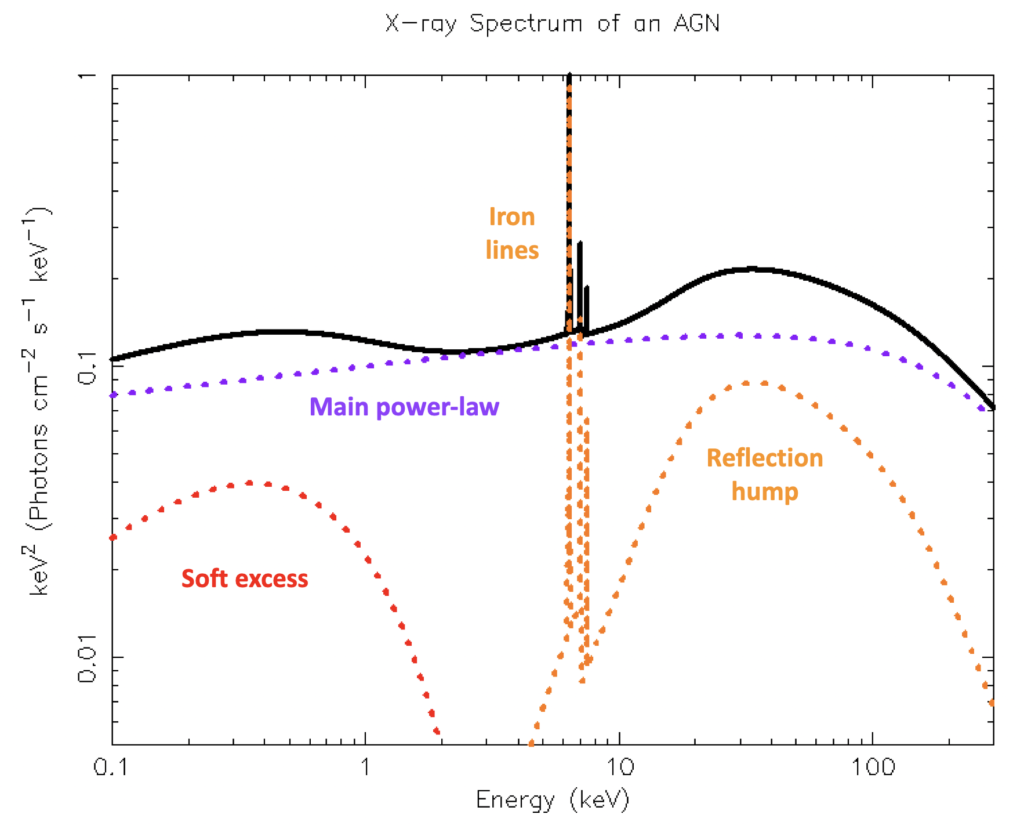
X-ray emission mostly arises from multiple inverse Compton (IC) upscatterings of accretion disk photons by hot electrons in the corona (e.g., Liang 1979). Multiple IC upscatterings yield a powerlaw spectrum, of photon-index of Γ = 1.9 in average (which flattens slightly to the apparent slope of Γ = 1.8 as a result of the contribution of a reflection component; e.g. Nandra & Pounds 1994), with a high-energy cutoff at energies of the order of 300-500 keV.
A broad X-ray hump is seen at energies 20 – 40 keV due to reflection of the upscattered photons onto the cold material of the torus, which generally results in an overall hardening of the spectrum (George & Fabian 1991). This reflection also produces intense emission lines, the most prominent of which is the FeK at 6.4 keV, which is often used as a clear indicator to diagnose the presence of an AGN.
Another X-ray component observed in AGN is the “soft excess”, an emission excess at energies < 2 KeV. Its origin is still debated, although it is frequently explained as comptonized emission from warm electrons on the surface of the accretion disk (e.g., Petrucci et al. 2018), or reflection from ionized disk material (Fabian et al. 2009).
Compton-thick AGN
The emission of an AGN, generated in the accretion disk and the corona, is surrounded by a dense torus of gas and dust. Therefore, depending on our viewing angle with respect to the central engine, part of the emission can be suppressed. When an AGN is viewed “edge-on” (i.e. through the torus) the optical and UV emission is extinguished, and even part of the X-ray emission can be absorbed.
The shape of the X-ray spectrum changes depending on the column density of hydrogen (NH) in the line of sight: higher energy photons can be absorbed/scattered away from the line of sight at larger NH. At the right we show the effect an increasing NH on the line of sight has on the X-ray spectrum of an AGN. The spectrum of a Compton-thin (lightly obscured) AGN is dominated by the intrinsic power law emission. As obscuration increases its flux is significantly reduced, until the emission can be completely dominated by the reflection component.
At column densities NH > 1.5 x 1024 cm-2 (the value corresponding to unity optical depth for Compton scattering) most of the AGN X-ray emission is suppressed at energies below ~10keV. These sources, which are called Compton-thick AGN, are not easily detected even with the help of X-ray facilities.
Missing Compton-thick AGN
According to the different models of Cosmic X-ray Background (CXB) the diffuse X-ray emission observed in the 1 to ∼200–300 keV band is mainly caused by AGN (e.g. Ueda et al. 2014). Particularly, at the peak of the CXB (∼30 keV; Ajello et al. 2008) a significant fraction of emission (10–25%) is expected to be produced by a numerous population of Compton thick AGN. Nonetheless, in the nearby Universe (z ≤ 0.1) the observed fraction of CT-AGN with respect to the total population is between 5 and 10% (e.g. Ricci et al. 2015). This is much lower than expected based on the majority of CXB model predictions (∼20–30%; see, e.g., Ueda et al. 2014). In some models the fraction of CT-AGN reaches even 50% of the overall population (e.g., Ananna et al. 2019).
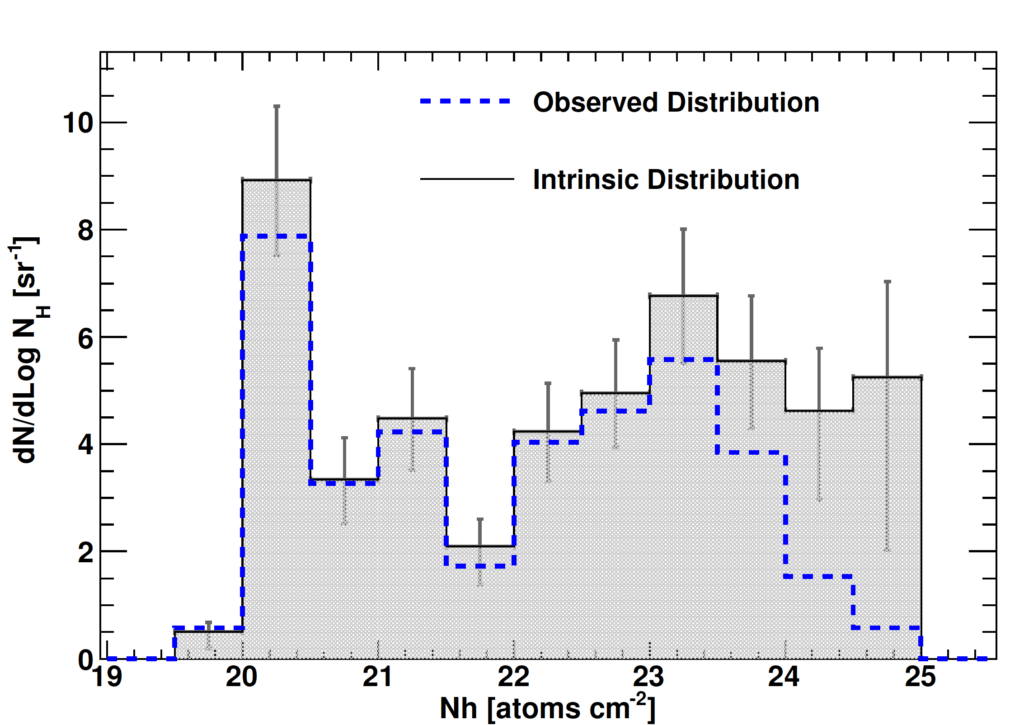
This must mean that even above 10 keV the AGN emission is strongly suppressed by absorption and Compton scattering, and the relatively low number of CT-AGN visible in the local Universe mostly reflects the bias against the detection of heavily obscured AGN. Modeling this selection effect, Burlon et al. (2011) recovered the intrinsic absorbing column density distribution (Left figure). This shows that CT-AGN should be fairly numerous, contrary to numbers derived from observations. The main objective of the CCTAGN project is to find the missing CT-AGN, which are necessary to explain the observed cosmic X-ray background.
The BAT volume-limited sample
Thanks to its wide field of view and more than 16 years of continuos scanning, BAT achieves sub-mCrab sensitivity at 15-150 keV in most of the high-latitude sky (Oh et al. 2018). BAT is the perfect instrument to study AGN in the local Universe and find new nearby CT-AGN. So far, BAT has detected 1100 confirmed AGN, only ~30 of which are certified bona-fide CT-AGN. If CT-AGN are really 20% of the total, where are they?
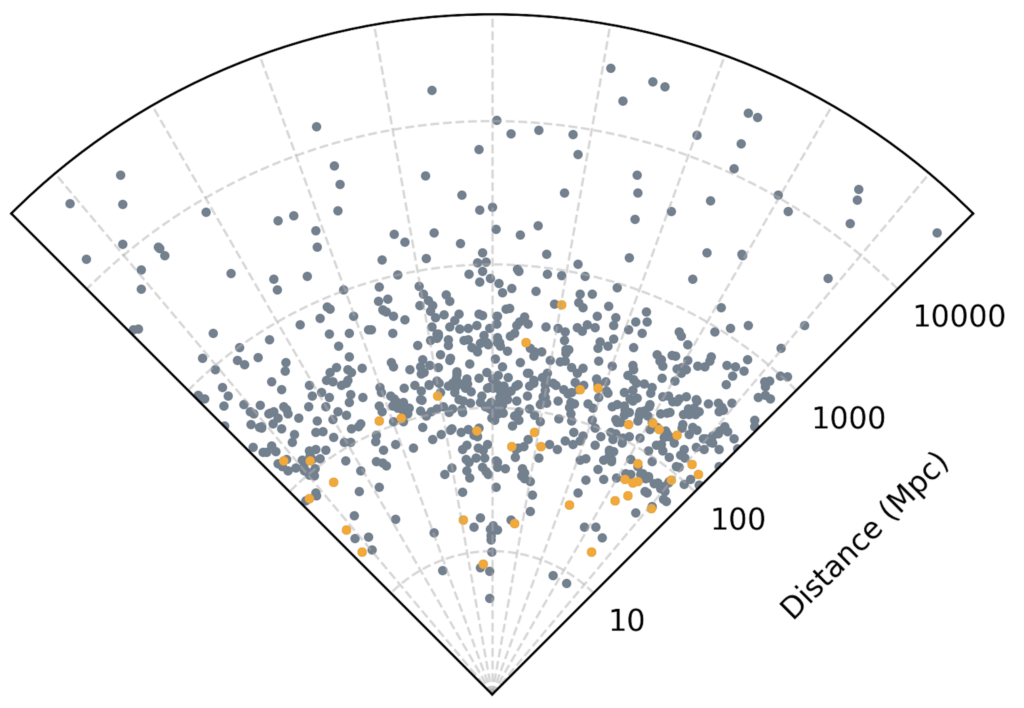
In the present day, almost 90% of them have been discovered at z ≤ 0.05 (within∼200 Mpc). In comparison, 90% of the population of unabsorbed and Compton-thin AGN falls within z ≤ 0.12 (Ricci et al. 2017), a factor 2.4 (in distance) higher. This is not surprising, since the extreme absorption severely suppresses the intrinsic AGN emission.
Since BAT is effective in detecting CT-AGN only in the very nearby Universe, we are developing a volume-limited sample of AGN detected by BAT in 150 months of observations within z < 0.05 (∼370 sources at |b| > 10; Marchesi et al. in prep).