223 Physics Lab: Oral Presentation

223 & 224 Lab Overview | Return to Physics Labs

Review the scenario below and answer the following questions as quickly and as completely as possible. If this is your first physics lab at Clemson, make sure that your group contains at least one person who took the 124 lab course last semester. Your group will be called on to orally answer several of the questions. Use concrete reasoning to answer your questions. When called upon, speak clearly and validate your reasoning with data. You will have about 2 minutes to present your answers to the class.


The "Experiment"

Imagine that you are sitting on a park bench watching pedestrians stroll along a sidewalk. The sidewalk is comprised of concrete blocks 1.0 meters wide. The edges of the concrete blocks serve as reference points which are used to determine the position of the passersby. To measure the passage of time, you decide to use, like Galileo before you, the beating of your own heart. It is determined that your heart beats between 59 and 61 times per minute.

To the right is the data taken from your observations of the movements of one person on the sidewalk. Your group should enter this data into an Excel spread sheet and answer the questions below. Use the Online Assistance links to help you.


Online Assistance

  1. Clemson Physics Lab Tutorials
  2. Using significant figures
  3. Measurement uncertainties
  4. Using Excel
  5. Graphing data using Excel
  6. Adding a trendline to an Excel plot
  7. Fitting multiple curves (trendlines) to one data set
  8. Using error bars in Excel


Questions to be Answered Orally

  1. What measurement errors are inherent in the observer's experiment?

  2. The temporal data is given in units of heart beats. Generally speaking, how is the "beat" converted into the more familiar unit of seconds? This is a rough estimate only.

  3. What is the maximum period of time between the observer's heart beats? What is the minimum period of time between beats?

  4. What is the uncertainty of the observer's measurement of time?

  5. What is the uncertainty of the observer's measurement of position?

  6. What are the magnitude of the error bars for the position measurements?

  7. In very general terms, describe what is observed. What might this person have been doing?

  8. What is the person's average velocity over the duration of the observation time?

  9. Discuss the validity of the third data point. Is this an acceptable data point? Why or why not?

  10. To how many decimal points can the position measurement be made?

  11. If we break up the observations into three time periods, what details can be concluded about the events between 0 and 10 seconds?

  12. What details can be concluded about the events between 10 and 22 seconds?

  13. What details can be concluded about the events between 25 and 37 seconds?

  14. Does the plotted data fit within the position error bars?

  15. What can be deduced about the age or physical demeanor of the person observed?

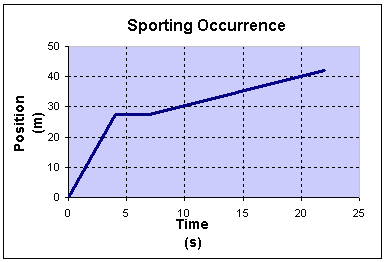
  16. Study the data plot of a person's position versus time below. If the person is professional athlete participating in his/her sport, what familiar sporting occurrence is the plot depicting? Justify your answer. (Answers may vary.)

  17. One student suggested, "The above plot represents a football player taking off to sack the quarterback. He is stopped momentarily by the offensive line, but he continues to move forward, albeit, more slowly." Discuss the reasons why the above graph probably does not represent this scenario.


Homework Assignment

Prepare a written abstract on your observations of this "experiment". Make sure that your Abstract directly and succinctly describes your observations, using numerical data to support your findings where possible. The abstract should include all pertinent results of the experiment, and yet remain concise. The abstract should be limited to one or two short paragraphs. Come with the Abstract printed out as well as saved on a floppy disk.]


Data, Results and Graphs

Enter TA password to view sample data and results of this experiment (MS Excel format):


Answers to Questions

Enter TA password to view the Answers to the questions for this experiment (MS Word format):


If you have a question or comment, send an e-mail to Lab Coordiantor: Jerry Hester

223 & 224 Lab Overview | Return to Physics Labs


Copyright © 2006. Clemson University. All Rights Reserved.
Photo's courtesy Corel Draw.
Last Modified on 01/27/2006 14:25:18