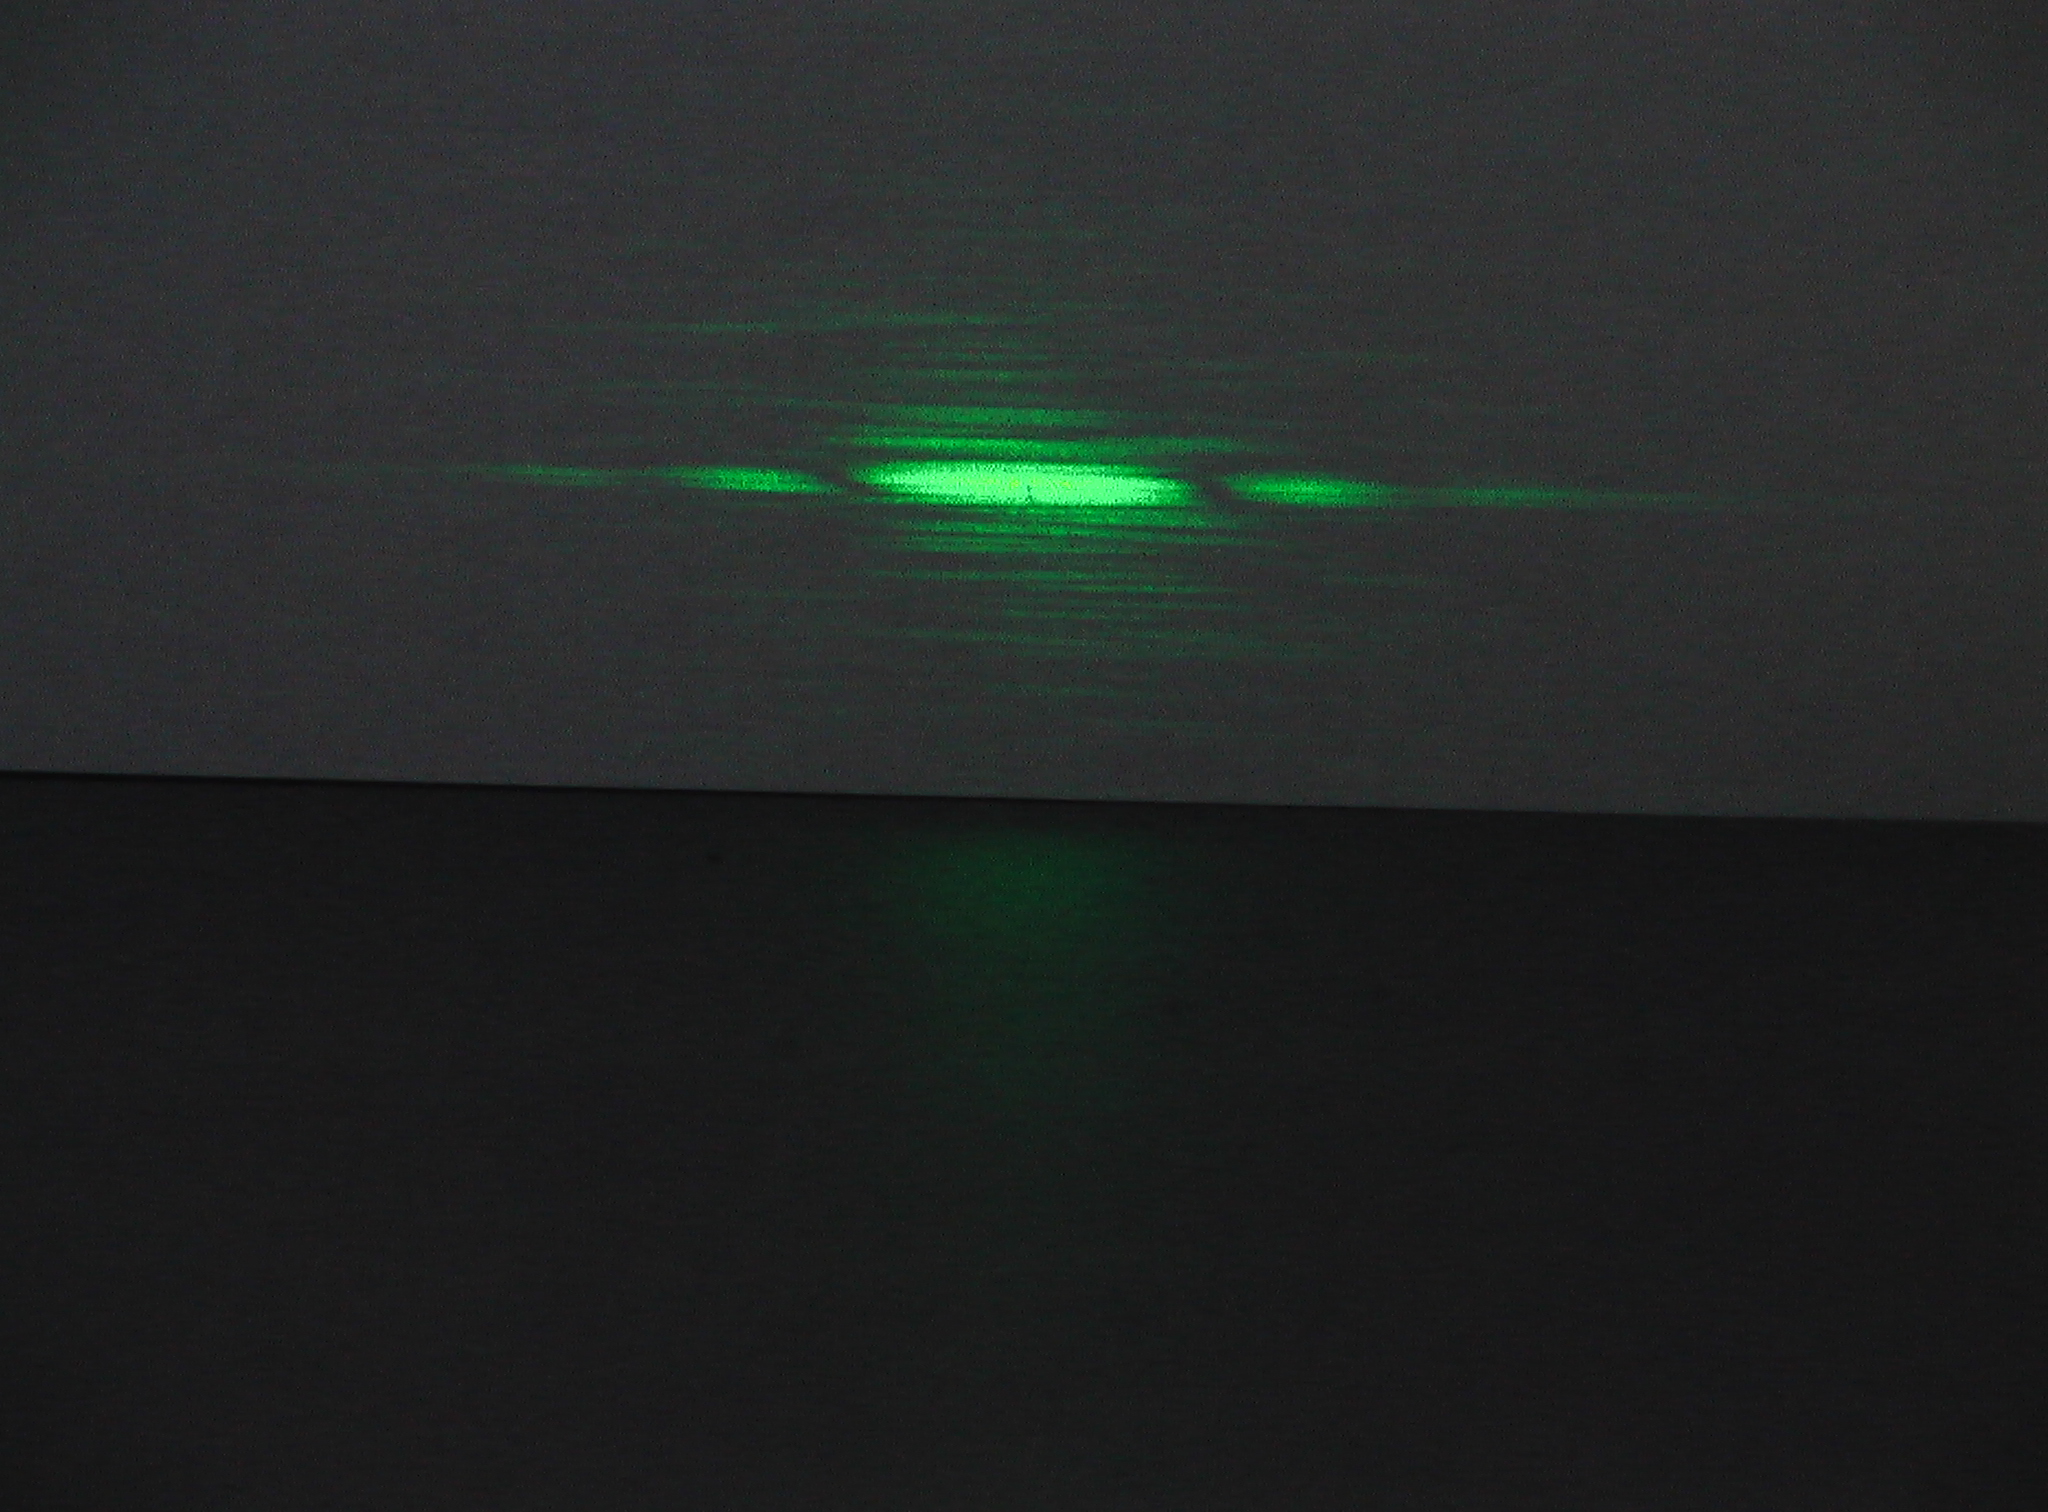
Purpose The purpose of this experiment is to examine the interference and diffraction of visible laser light as it passes through narrow single and double slits.
Background
The wave properties of light are most easily demonstrated by the interference and diffraction
of a beam of light as it passes through one or more small slits. The wave nature of the light
results in a pattern with a series of bright and dark regions related to the wavelength of the
light and the number and size of the slits.
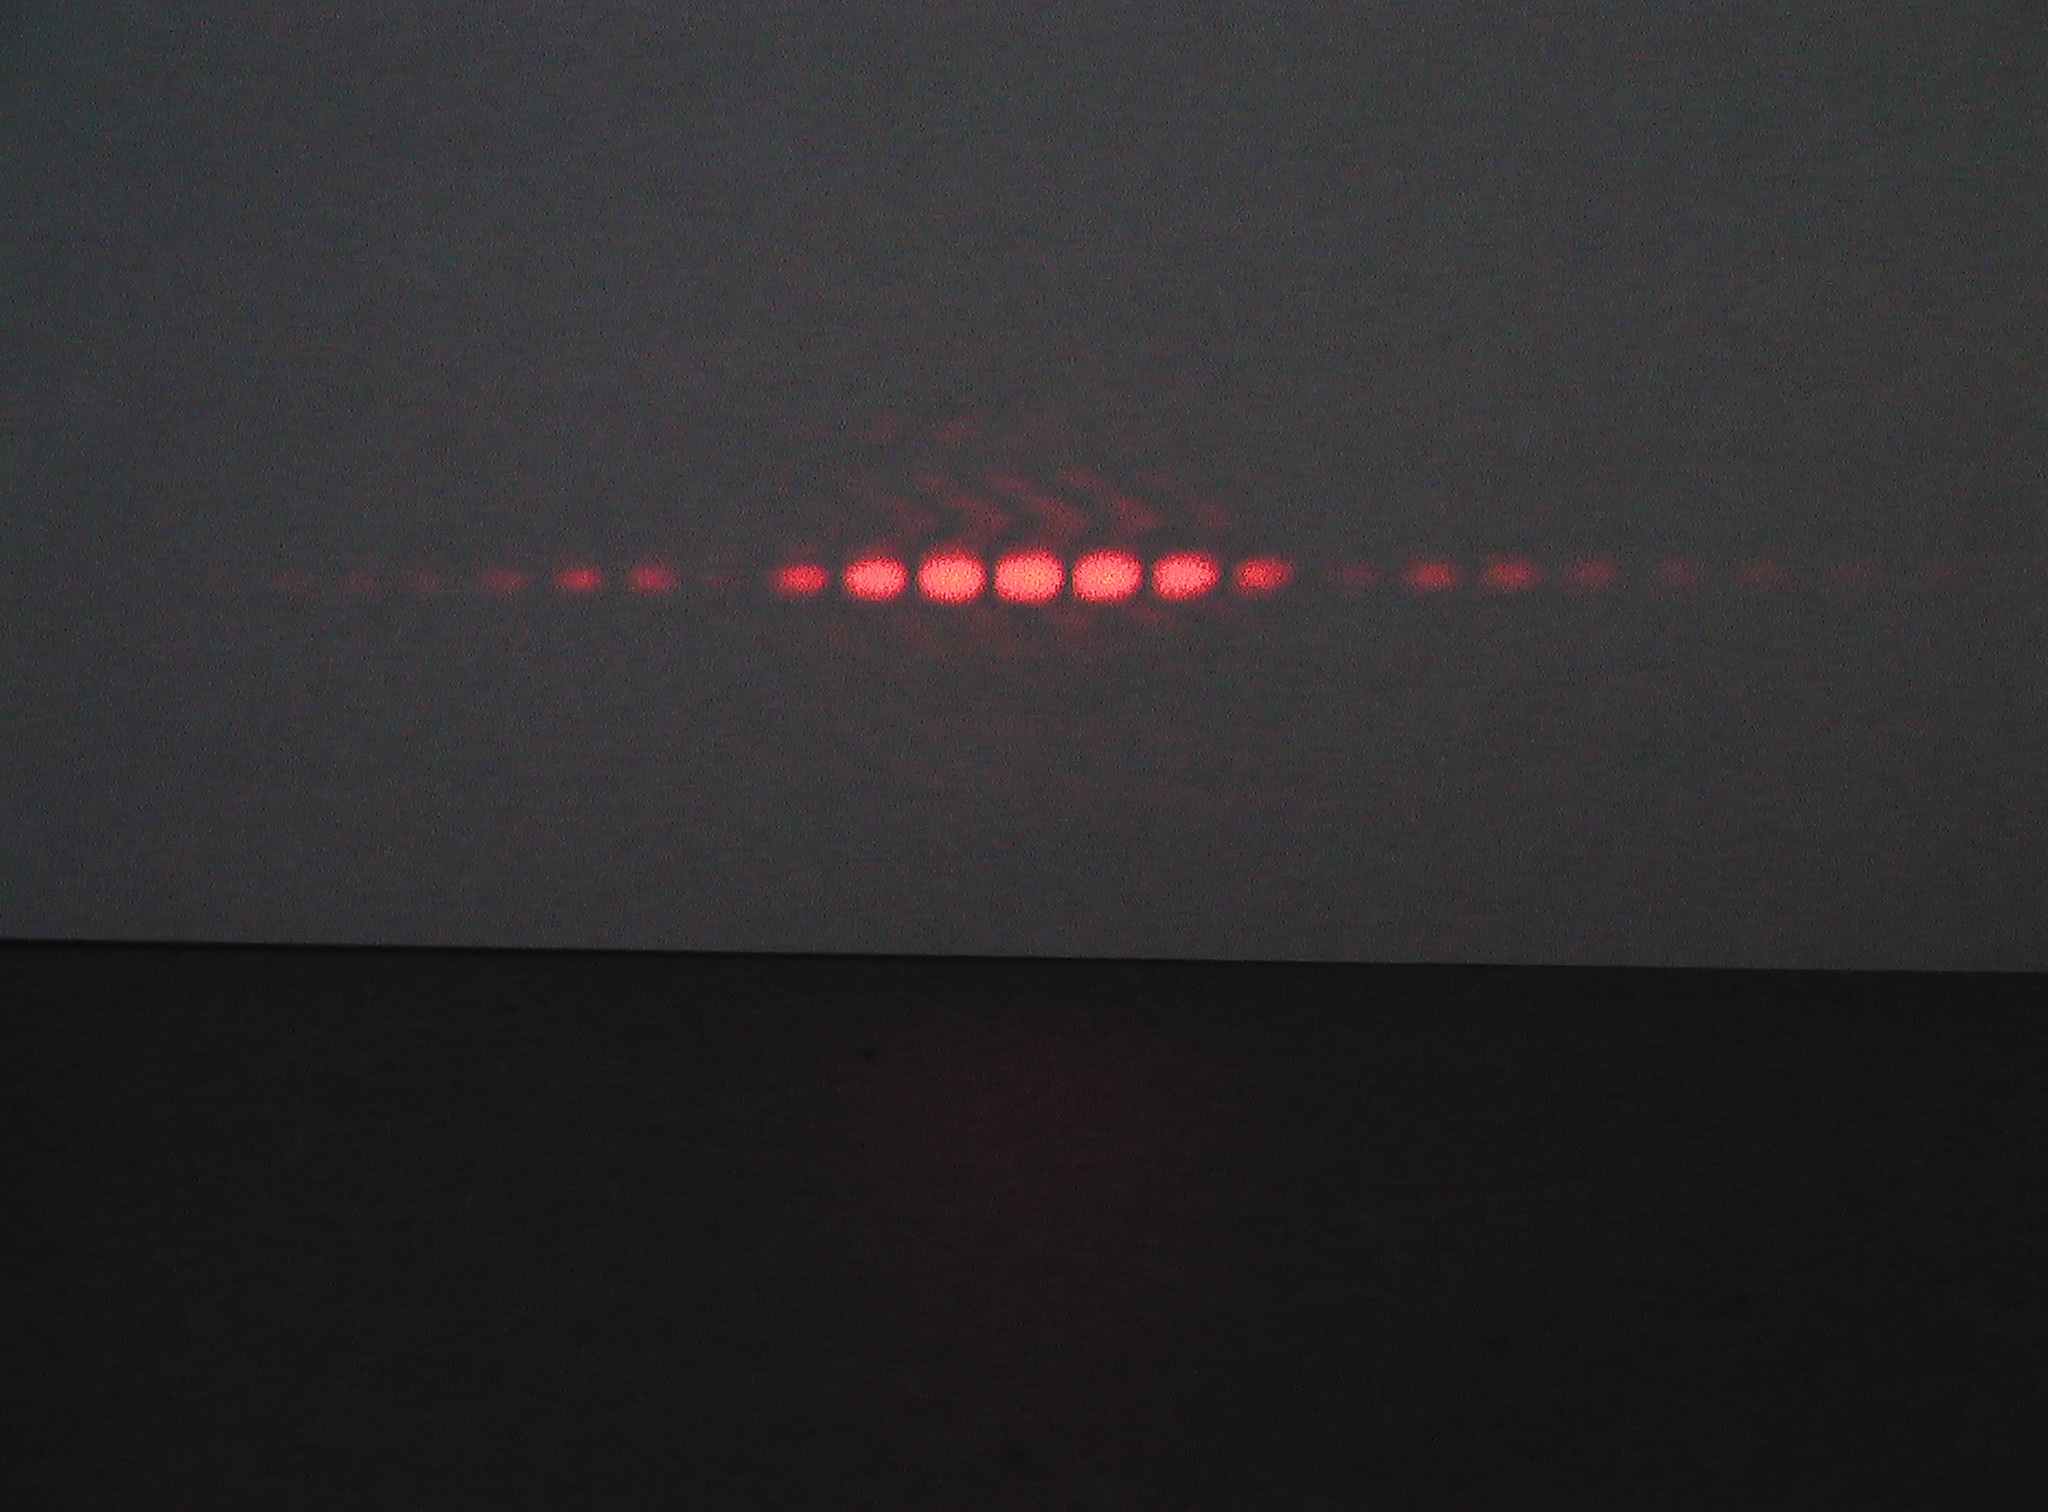
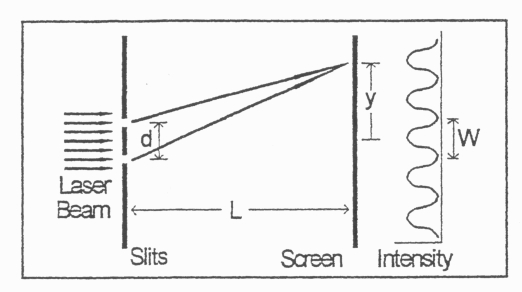
In 1801 Thomas Young demonstrated this wave nature of light by observing the pattern formed when a narrow beam of light was sent through a pair of narrow slits. In a similar way, if a laser beam is passed through two vertical narrow slits onto a distant screen, a horizontal pattern of equally spaced dots is observed. The bright and dark regions are due to the constructive and destructive interference of the light waves from the two slits. The geometry of the double slit setup is shown in Figure 1 where d is the slit separation, L is the distance from the slits to the screen, and y is the distance measured from the center of the pattern.
When the distance which the light beams travel from the two slits to the screen differs by one-half wavelength, the two beams will cancel, and a dark region (minimum) will be observed. When the screen is far from the slits, the positions of these minima are given by
where n is an integer, and
This distance W will be referred to as the width of the interference peak. It is constant for
all peaks in this interference pattern.
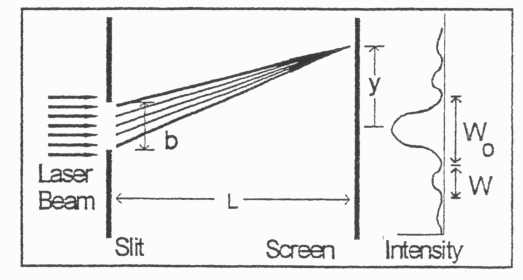
When a beam of light passes through a narrow vertical single slit, the beam is observed to spread out horizontally. This bending of the beam as it passes through a narrow opening is known as diffraction. This diffraction pattern is also observed to have a series of maxima and minima due to the interference effects of the light passing through different portions of the single slit. The geometry of this single slit setup is shown in Figure 2, where b is the width of the slit.
The central maximum is by far the brightest part of this pattern. The positions of the minima in this single slit pattern are given by
The distance W0 between the minima on either side of the central peak is found from Equation 3 to be twice the distance W between the other adjacent minima.
The effect of the single slit diffraction is also observed in the double slit interference pattern. When the light beam passes through the slits it spreads horizontally due to diffraction. The reason that the double slit pattern gradually decreases in intensity is due to the decrease in intensity of the light coming from the individual slits.
Objectives
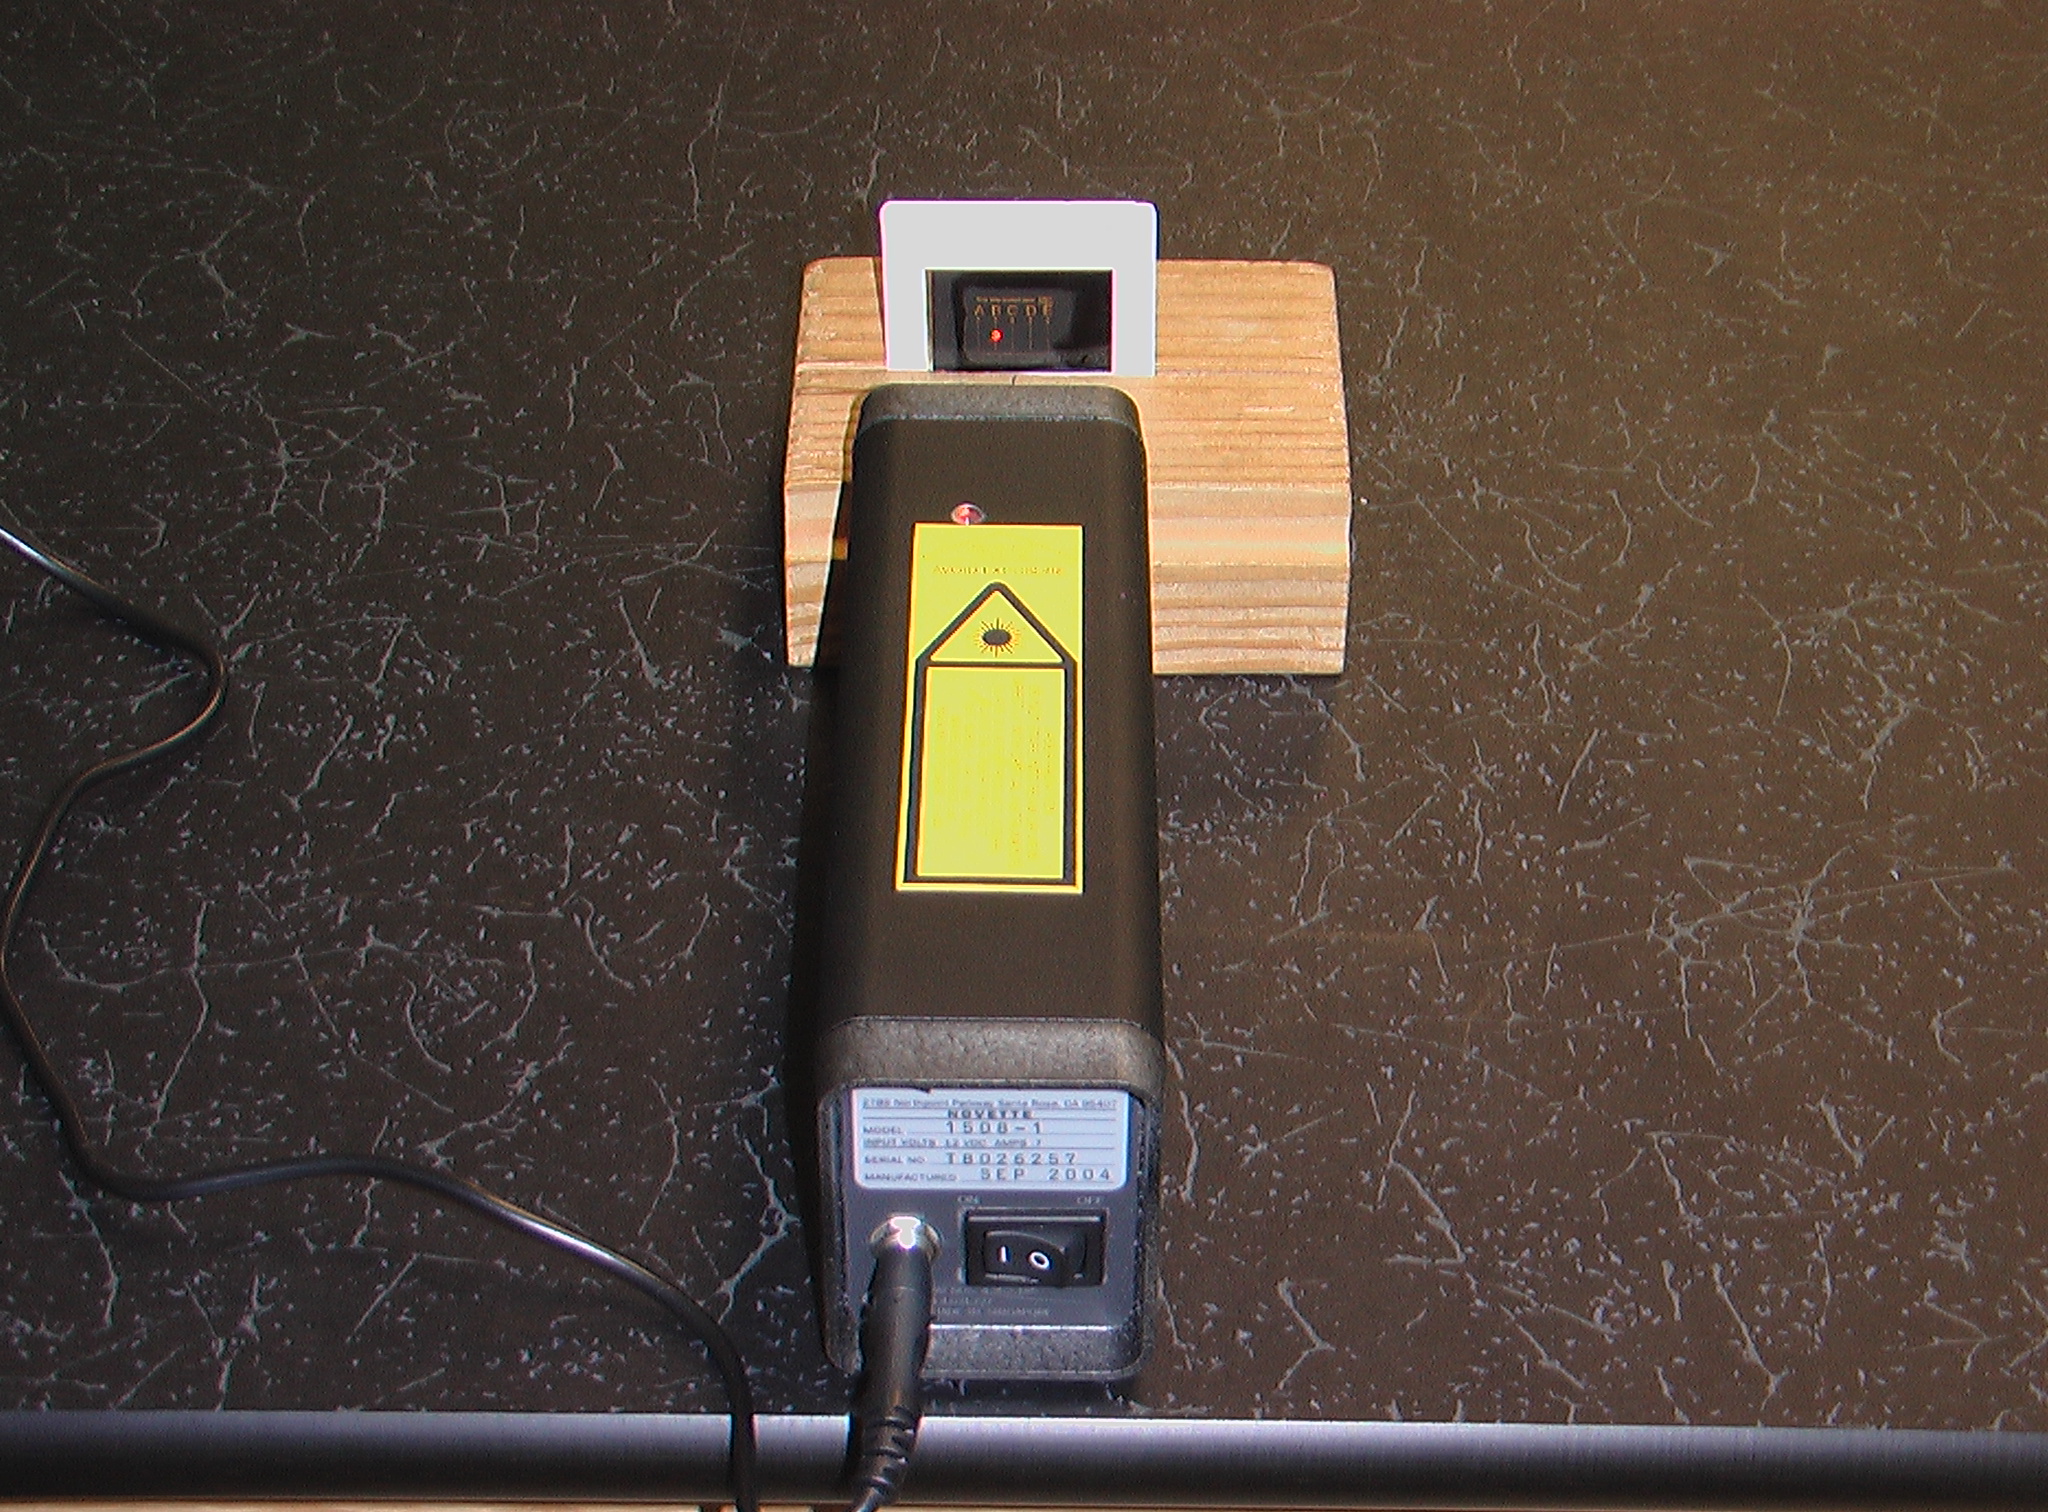
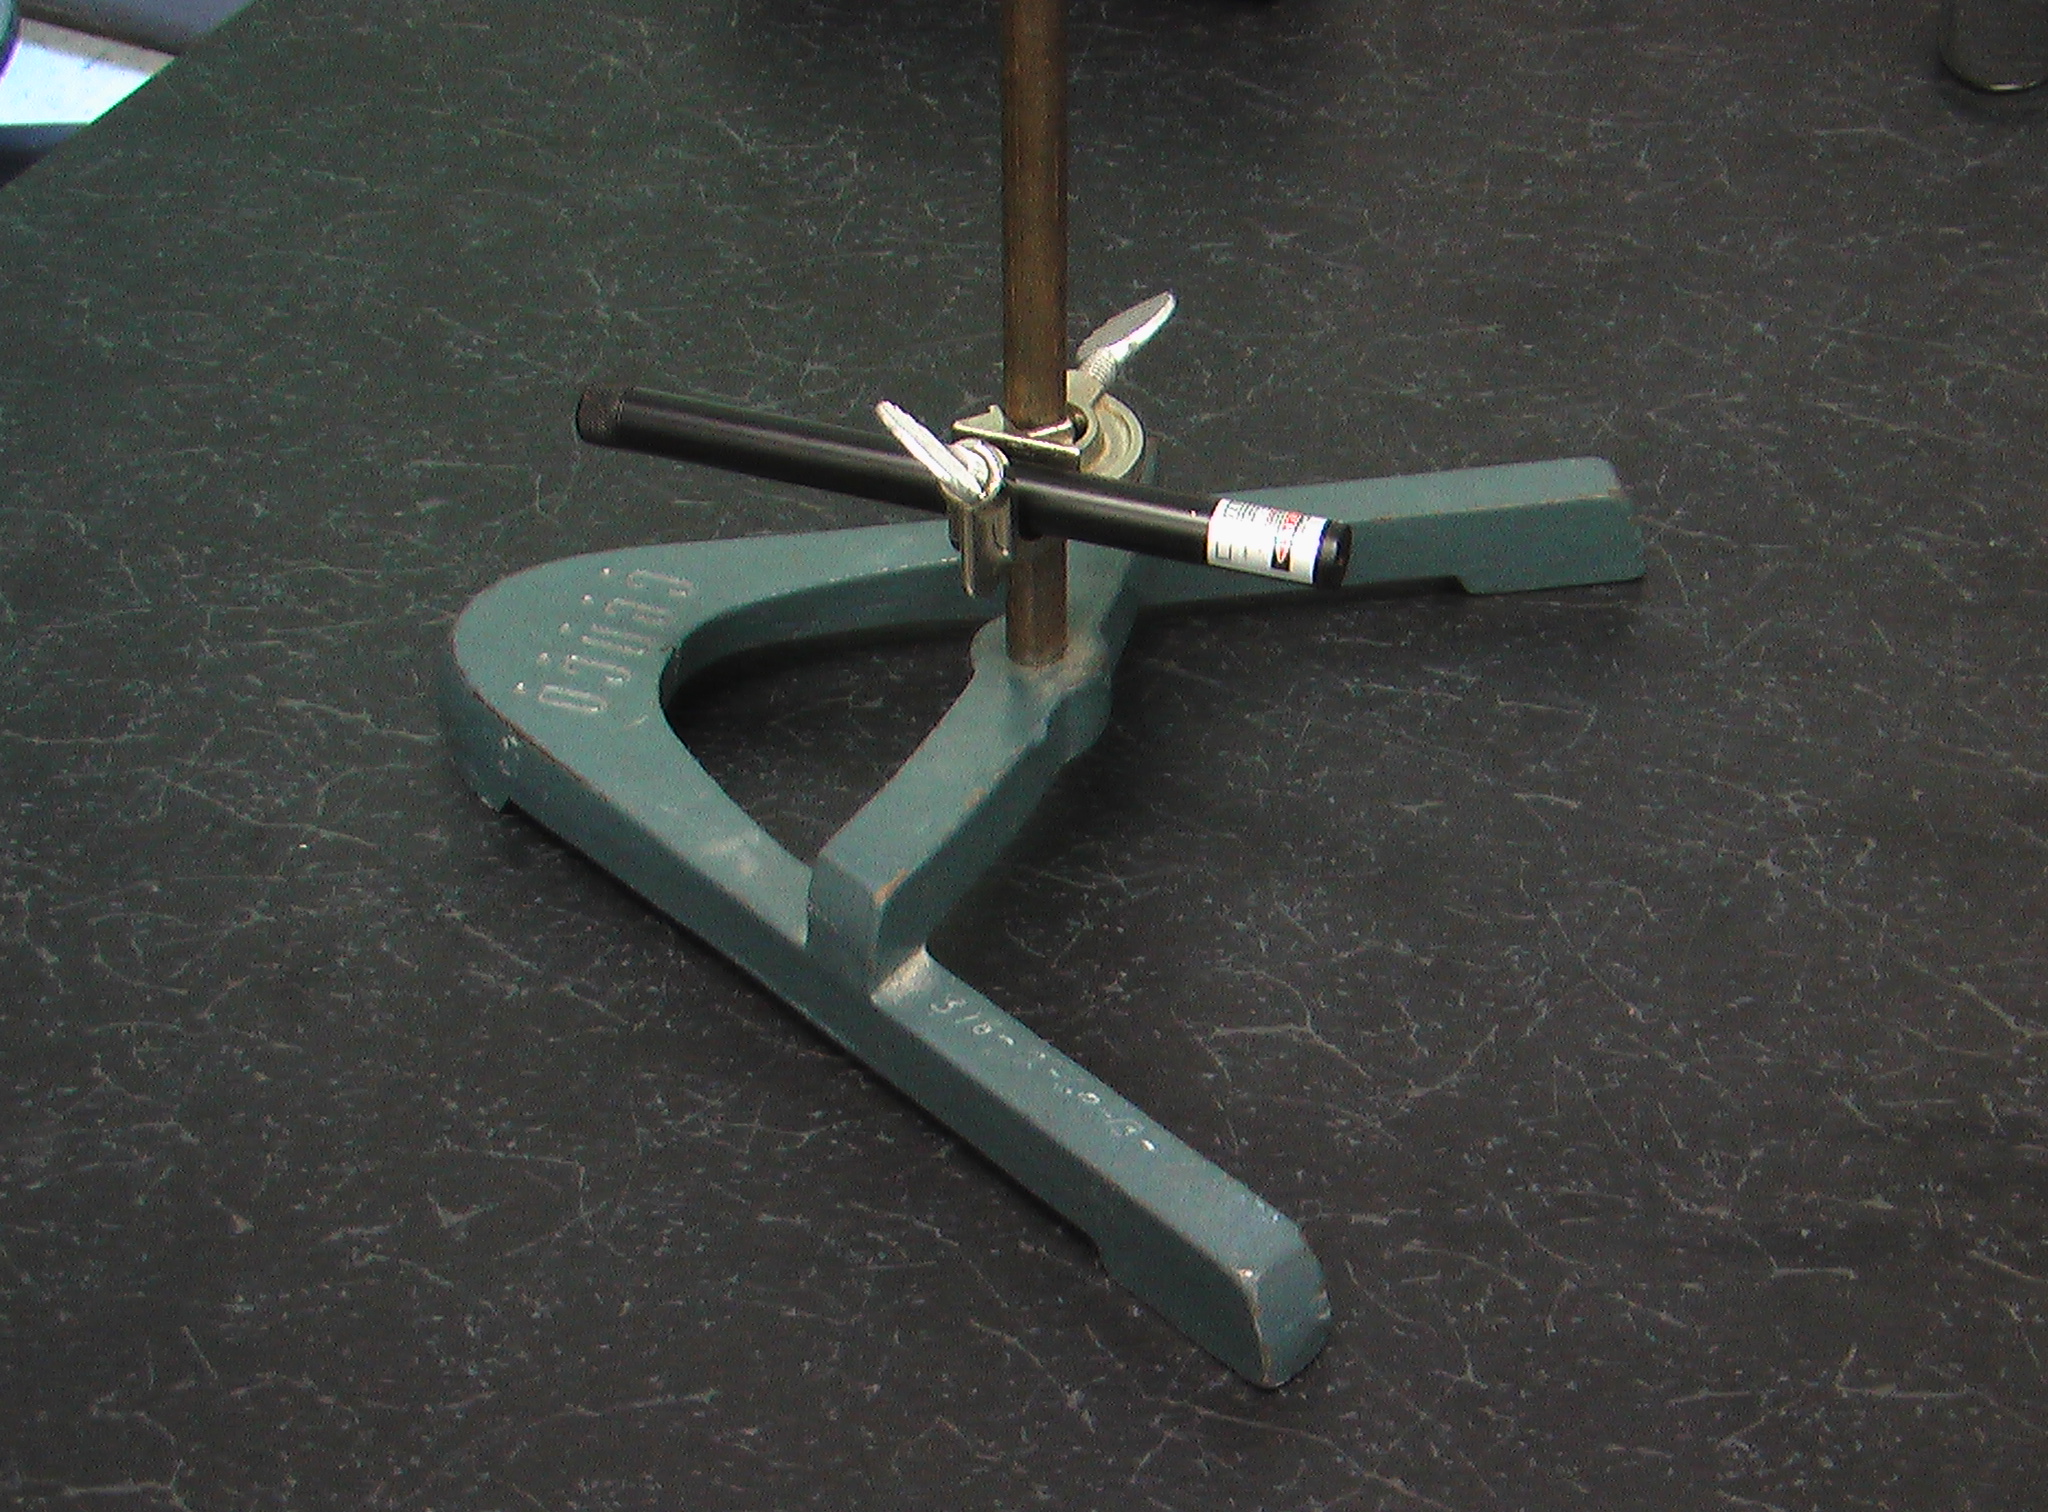
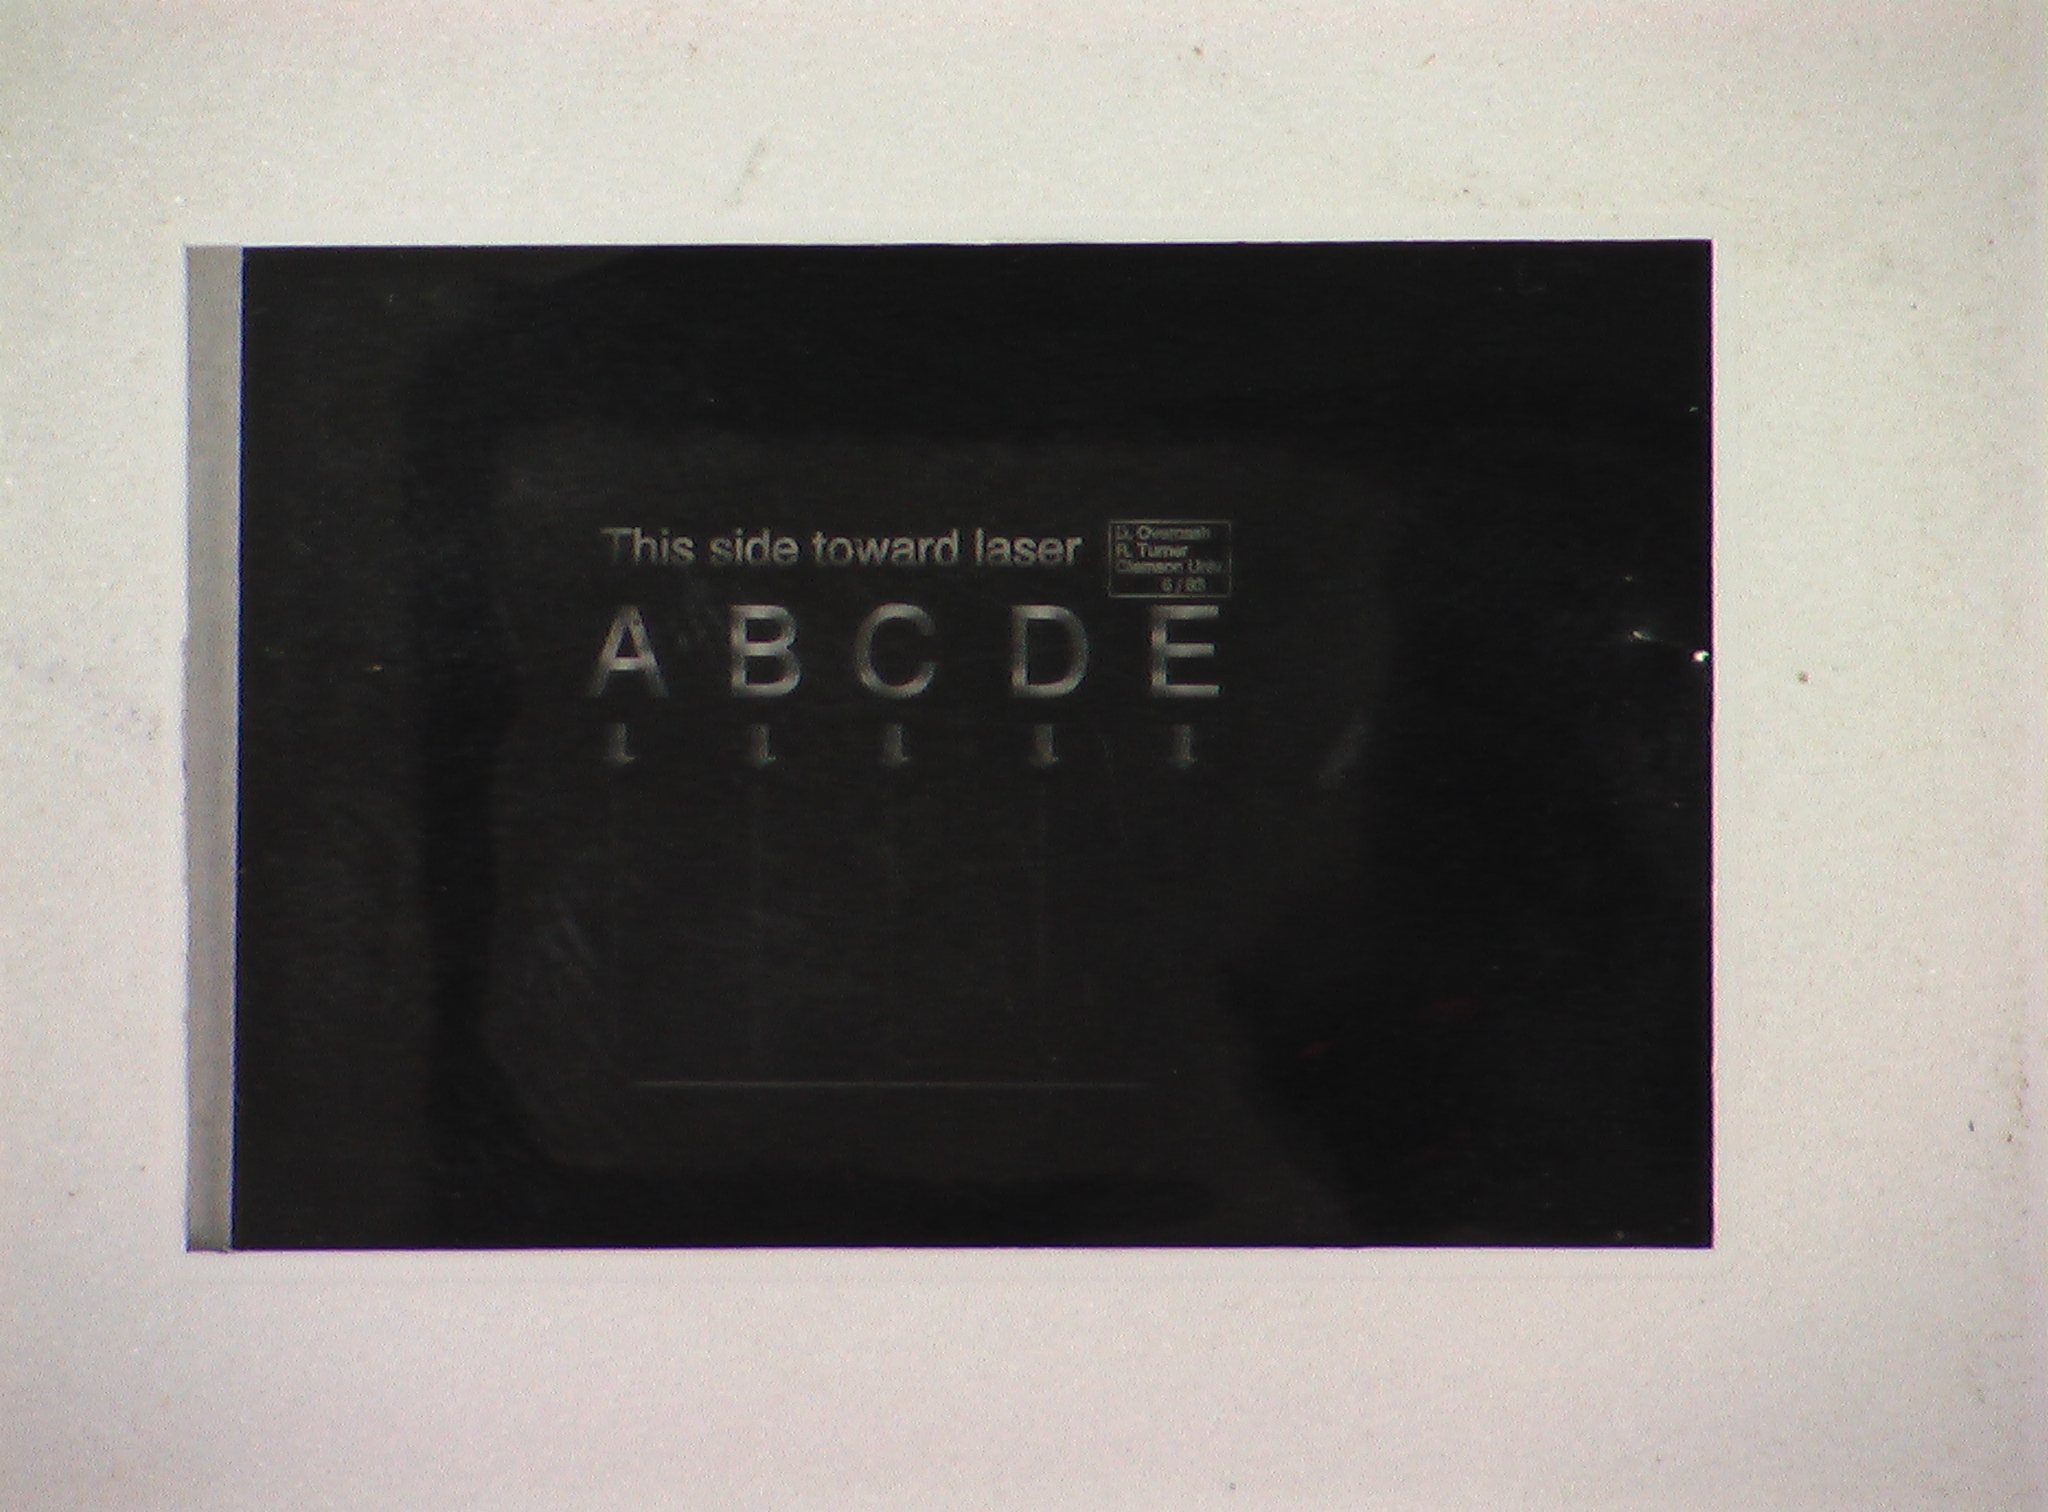
Equipment and setup
Hints and Cautions
Online Assistance
Lab Report Template Each lab group should download the Lab Report Template and fill in the relevant information as you perform the experiment. Each person in the group should print-out the Questions section and answer them individually. Since each lab group will turn in an electronic copy of the lab report, be sure to rename the lab report template file. The naming convention is as follows:
For example the group at lab table #5 working on the Ideal Gas Law experiment would rename their template file as "5 Gas Law.doc".
Questions Each student should download the questions. Each person in the group should print out the questions and answer them individually. Discussing the questions as a group is acceptable, but each student is responsible for turning in answers that represent their own work, not the work of others.
Nudge Questions These Nudge Questions are to be answered by your group and checked by your TA as you do the lab. They should be answered in your lab notebook. General Nudges
TA Notes
Data, Results and Graphs
Answers to Questions
Lab Manual
CUPOL Experiments As of now, there are no CUPOL experiments associated with this experiment.
If you have a question or comment, send an e-mail to the Lab Coordinator: Jerry Hester
|
|||||||||||||||||||||||||||||||||||
|
|

Copyright © 2006. Clemson University. All Rights Reserved. Photo's courtesy Corel Draw. Last Modified on 01/27/2006 14:25:18 |

 is the wavelength of the light. It can easily be shown from
Equation 1 that the minima in the light intensity are equally spaced with a spacing W given by
is the wavelength of the light. It can easily be shown from
Equation 1 that the minima in the light intensity are equally spaced with a spacing W given by